Interactive Land Use Map
Zoom in to 10–30 m resolution and scrub the 2020–2024 time slider to watch landscapes change over time.
Explore ecosystem extent, condition, services and risks — anywhere in the world. Curated, decision-ready Earth Observation data that anyone can use, with no GIS expertise required.
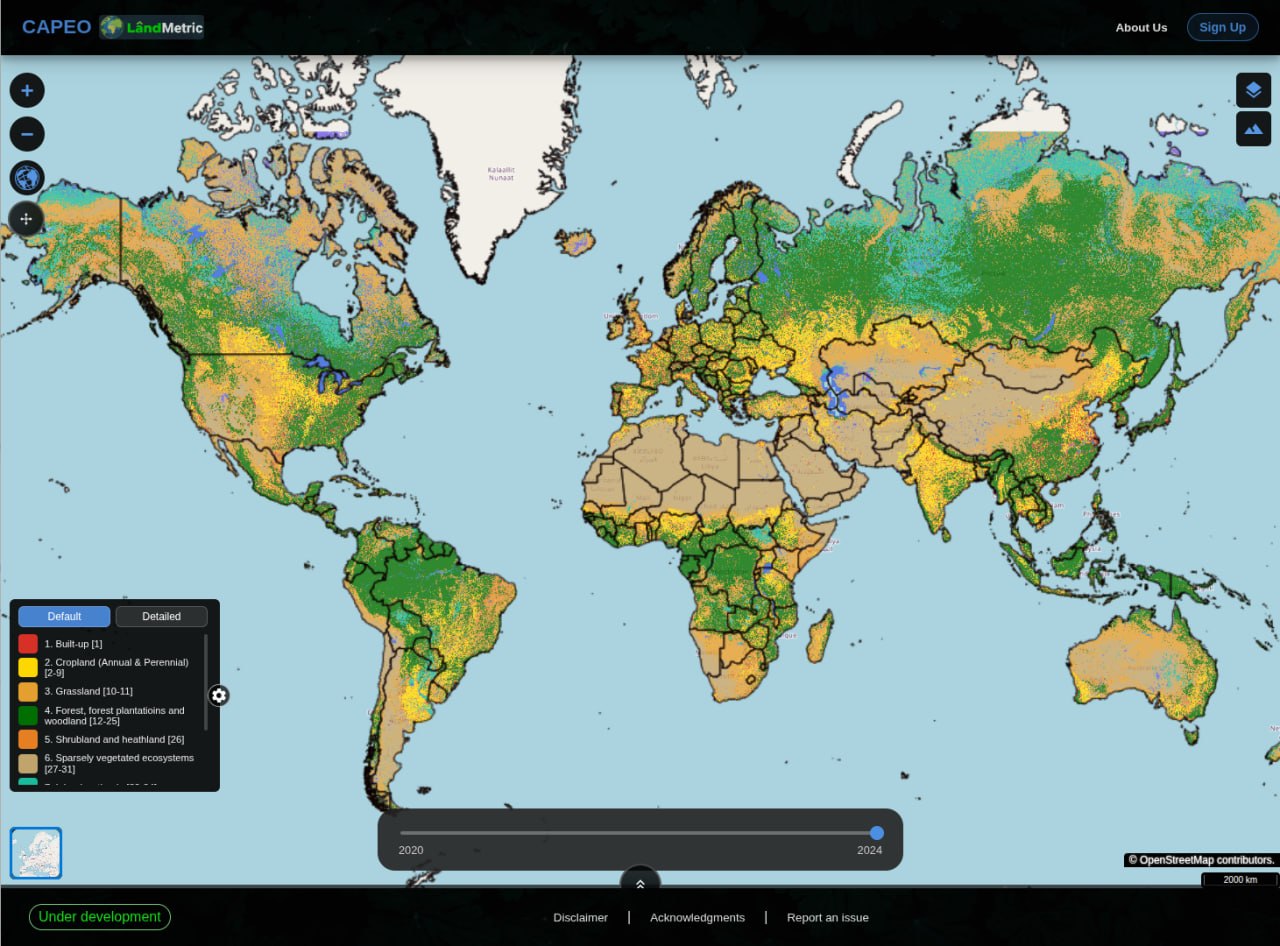
From a quick look at land cover to full multi-year, multi-layer analysis — LandMetric turns complex Earth Observation data into clear, actionable insight.
Zoom in to 10–30 m resolution and scrub the 2020–2024 time slider to watch landscapes change over time.
Soil, carbon, vegetation, water, biomass, climate, socio-economics, climate scenarios and fire, drought and flood risk — ready to analyze.
Layer of administrative boundaries, protected areas and building footprints over any analysis.
Analyse specific points, administrative regions, import boundaries or select your own area on-screen - and prepare charts and tables, or assess trends. Or compare trends in two different areas to measure project impacts.
Import the boundaries of your areas of interest, analyse, and export the results you need to process in a GIS. Or use the tool to access open-access global, high resolution GEOTIFF files that are available for all data layers in the tool with a REST API. Or simply download a chart that you created as png file for inclusion in your report.
Many of the data layers are backed up by scientific publications - referenced in the tool in a dedicated STAC catalog.
Use the tool to access ESRI Very high resolution (30 cm) image time series for your area of interest for visual inspection.
Register on the tool in order to make an account to save your data layers and analyses, or share them with your colleagues. All you need is an email address – use of the tool is free.
Dive into the live app, or start with the step-by-step guide — no account is needed to explore the maps.