Datasets — Raster layers & Vector layers
Landmetric organizes data into two types: raster layers and vector layers. Raster data are the thematic data that inform on the health of ecosystems and agro-ecosystems. Vector data indicate the boundaries of administrative areas or protected areas – that can be used as area of interest for which you can analyze the thematic data.
Raster Layers
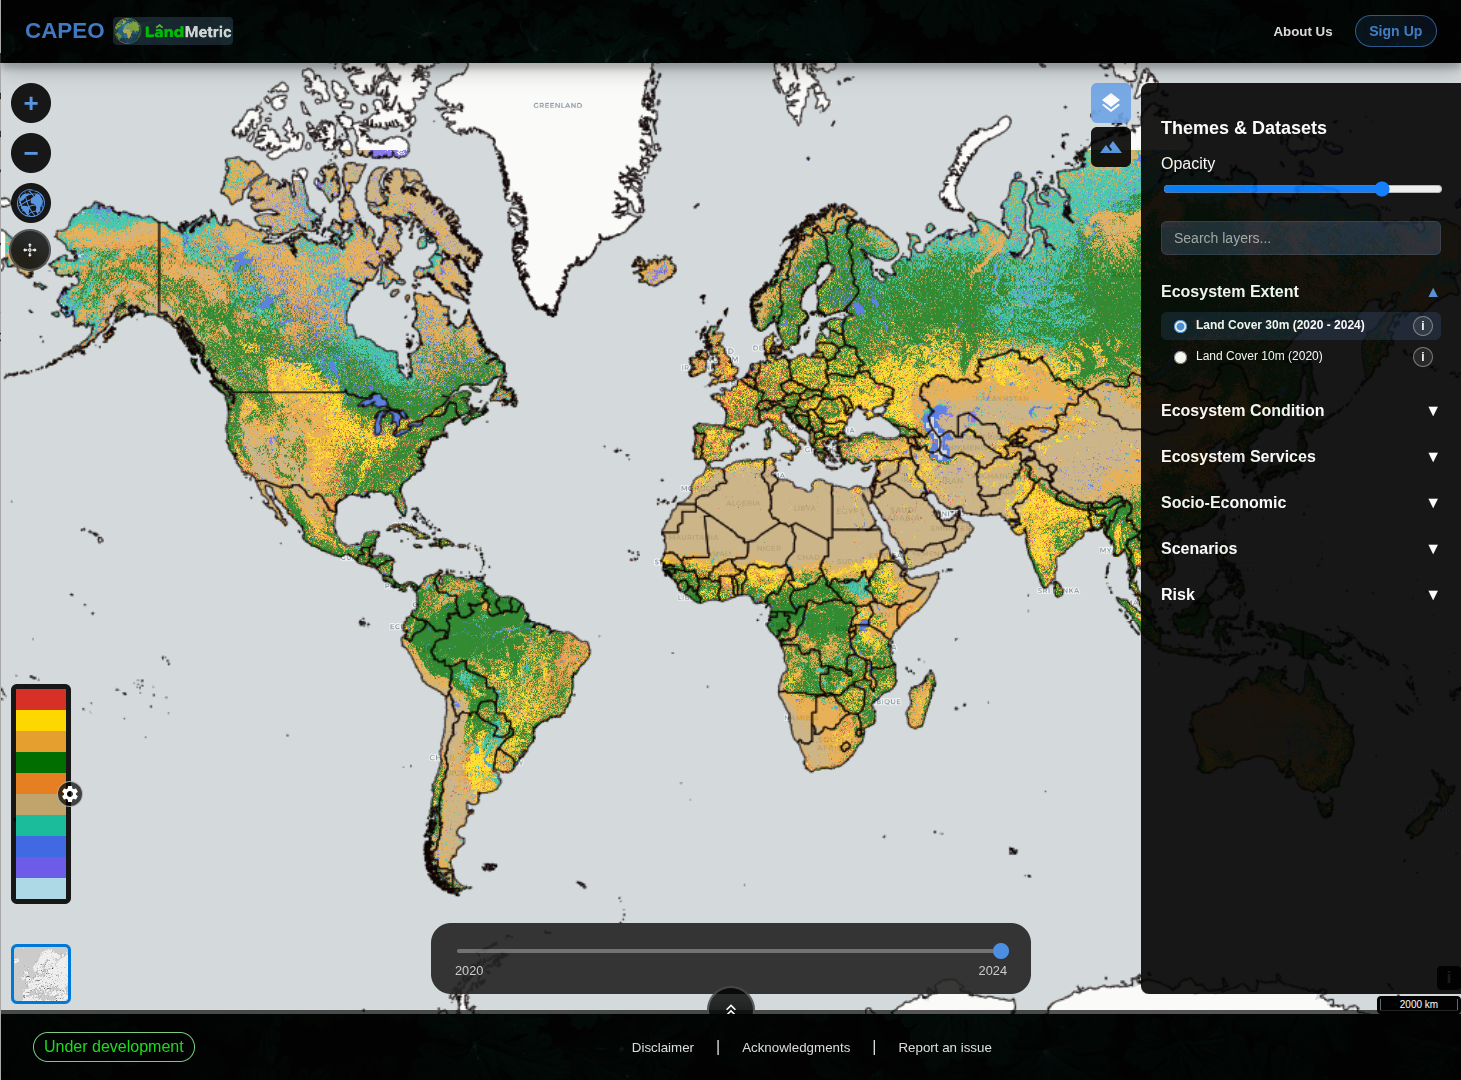
Open the Themes & Datasets panel (top-right diamond icon) to browse layers by theme. Click a layer name to add it to the map, use the opacity slider to adjust transparency, and click the ⓘ icon next to any layer to open its full metadata page (title, timeframe, spatial resolution, and provider), sourced directly from our STAC catalog.
Ecosystem Extent
| Layer | Resolution | Period | Description |
|---|---|---|---|
| Land Cover | 30 m | 2020–2024 | Annual pan-EU land cover classification |
| Land Cover | 10 m | 2020 | High-resolution land cover snapshot |
Ecosystem Condition — Soil
| Layer | Unit | Resolution | Period | Description |
|---|---|---|---|---|
| Soil Organic Carbon Density | mg/cm³ | 30 m | 2000–2022 | SOC mass per unit volume of soil |
| Soil Organic Carbon Content | g/kg | 30 m | 2000–2022 | SOC concentration by mass |
| Soil pH (in Water) | — | 30 m | 2000–2022 | Soil reaction measured in water suspension |
| Bare Soil Fraction | % | 30 m | 1997–2024 | Fraction of bare soil per pixel per year |
| Soil Type | USDA class | 30 m | 2000–2022 | USDA soil texture classification |
| Soil Organic Carbon Stock | tC/ha | 100 m | 2007–2021 | Total organic carbon stock in topsoil |
Ecosystem Condition — Vegetation
| Layer | Unit | Resolution | Period | Description |
|---|---|---|---|---|
| Net Primary Production | gC/m²/month | 300 m | 2018–2025 | Carbon fixed by plants per unit area per month |
| Rain Use Efficiency | gC/m²/mm | 30 m | 2020–2024 | NPP per mm of rainfall — drought resilience indicator |
| Short Vegetation Cover | % | 30 m | 2000–2024 | Fraction of pixel covered by short vegetation |
| NDWI | — | 30 m | 1997–2024 | Normalized Difference Water Index — vegetation water content |
| NDVI | — | 30 m | 1997–2024 | Normalized Difference Vegetation Index — greenness proxy |
| Aboveground Biomass Carbon Stock | tC/ha | 100 m | 2007–2022 | Carbon stored in above-ground biomass |
| Belowground Biomass Carbon Stock | tC/ha | 100 m | 2007–2022 | Carbon stored in root biomass |
| Litter Carbon Stock | tC/ha | 100 m | 2007–2022 | Carbon in dead organic matter on the ground |
| Deadwood Carbon Stock | tC/ha | 100 m | 2007–2022 | Carbon in standing dead wood |
| Tree Density Cover | % | 10 m | 2020 | Fraction of pixel covered by tree canopy |
Ecosystem Condition — Water
| Layer | Unit | Resolution | Period | Description |
|---|---|---|---|---|
| Precipitation | mm/month | 1000 m | 2000–2024 | Monthly total precipitation |
| Evaporation in Soil Surface and Water Bodies | mm/year | 300 m | 2018–2024 | Annual evaporation from soil and open water |
| Actual Evapotranspiration | mm/year | 300 m | 2018–2024 | Annual actual ET (soil + canopy) |
| Irrigated Croplands | — | 30 m | 2020–2024 | Binary mask of irrigated agricultural areas |
Ecosystem Services
Other
| Layer | Unit | Resolution | Period | Description |
|---|---|---|---|---|
| Gross Dry Matter Productivity | gC/m²/day | 300 m | 2014–2023 | Daily dry matter production rate |
| Carbon Storage | tC/ha | 100 m | 2007–2021 | Total carbon storage (above + below ground) |
Livestock
| Layer | Unit | Resolution | Period | Description |
|---|---|---|---|---|
| Distribution of Horses | headcount / km² | 1000 m | 2000–2022 | Gridded livestock density |
| Distribution of Buffaloes | headcount / km² | 1000 m | 2000–2022 | Gridded livestock density |
| Distribution of Cattle | headcount / km² | 1000 m | 2000–2022 | Gridded livestock density |
| Distribution of Goats | headcount / km² | 1000 m | 2000–2022 | Gridded livestock density |
| Distribution of Sheep | headcount / km² | 1000 m | 2000–2022 | Gridded livestock density |
Socio-Economic
| Layer | Resolution | Period | Description |
|---|---|---|---|
| Characteristics of Built-Up Areas (2018) | 10 m | 2018 | Urban extent and built-up density |
| Real Gross Domestic Product | 100 m | 1992–2019 | PPP-$/km²/yr — gridded economic output |
| Gridded Human Development Index | 100 m | 1990–2015 | Composite HDI at grid level |
| Population Grid | 100 m | 2000–2025 | People per hectare |
Scenarios
Projections under IPCC Representative Concentration Pathways:
| Layer | RCPs | Resolution | Period | Description |
|---|---|---|---|---|
| Projected Population Grid | — | 100 m | 2030 | Future population density |
| Projected Precipitation | 2.6, 4.5, 8.5 | 1000 m | 2041-2080 | mm/month — future rainfall scenarios |
| Projected Near-Surface Air Temperature | 2.6, 4.5, 8.5 | 1000 m | 2041-2080 | °C/month — future temperature scenarios |
RCP 2.6 = ambitious mitigation · RCP 4.5 = moderate · RCP 8.5 = high emissions
Risk
| Layer | Resolution | Period | Description |
|---|---|---|---|
| Inundation Frequency | 30 m | 2011–2021 | % of time an area is flooded |
| Flood Exposure — SLR 2-yr Return Period | 90 m | 2018 | metres of sea-level rise exposure, 2-yr event |
| Flood Exposure — SLR 100-yr Return Period | 90 m | 2018 | metres of sea-level rise exposure, 100-yr event |
| Projected Flood Exposure — RCP 8.5, 2-yr | 90 m | 2050 | Future flood exposure under high emissions |
| Projected Flood Exposure — RCP 8.5, 100-yr | 90 m | 2050 | Future flood exposure under high emissions |
| Fire Frequency | 30 m | 2014-2024 | Annual count of fire events |
| Drought Risk | 5000 m | 1998-2025 | Based on longest dry period in the past |
Vector Layers
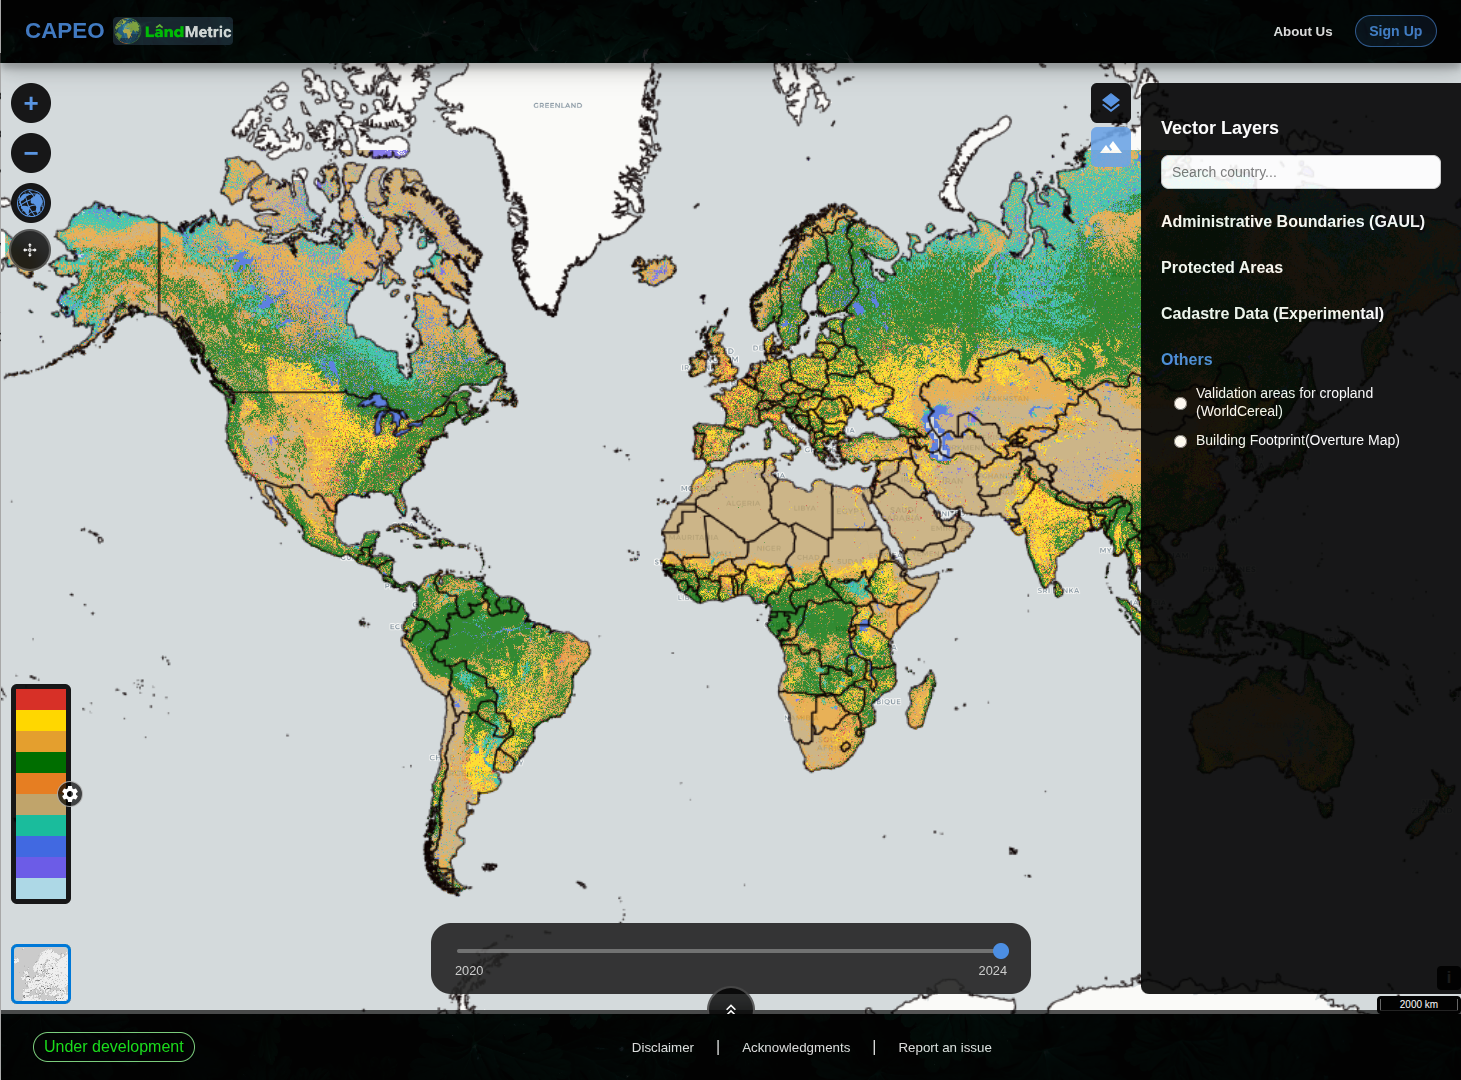
Open the Vector Layers panel (top-right mountain icon) to toggle boundary and reference geometry on top of the raster data.
Administrative Boundaries (GAUL)
The Global Administrative Unit Layers from FAO provide three nesting levels:
| Layer | Level | Description |
|---|---|---|
| Countries | Level 0 | National borders |
| Regions | Level 1 | States / provinces / NUTS-2 equivalents |
| Districts | Level 2 | Municipalities / counties / NUTS-3 equivalents |
Use these to contextualize raster data within political boundaries — and remember, hovering over any region for ~3 seconds reveals its name (see Map & Navigation).
Protected Areas
| Layer | Source | Description |
|---|---|---|
| World Database on Protected Areas (WDPA) | UNEP-WCMC / IUCN | Global inventory of marine and terrestrial protected areas |
Cadastre Data (Experimental)
| Layer | Coverage | Notes |
|---|---|---|
| Denmark | National | Danish cadastral parcels |
| Brazil (SICAR) | National | Brazilian rural property registry |
| Others | Variable | Additional countries added as data becomes available |
Experimental: Cadastre layers are experimental — boundaries may be incomplete or misaligned. Use for visual reference only.
Others
| Layer | Source | Description |
|---|---|---|
| Validation areas for cropland | WorldCereal | Reference sites used to validate cropland maps |
| Building Footprint | Overture Map | Global building footprint polygons |
Next: Tools →