Data Exportation
Once you've selected, drawn, or compared an area on the map, LandMetric lets you go beyond the on-screen chart: you can browse detailed accounting tables, download the underlying numbers as CSV, and view a visual breakdown of land-cover composition over time.
Accounting Tables
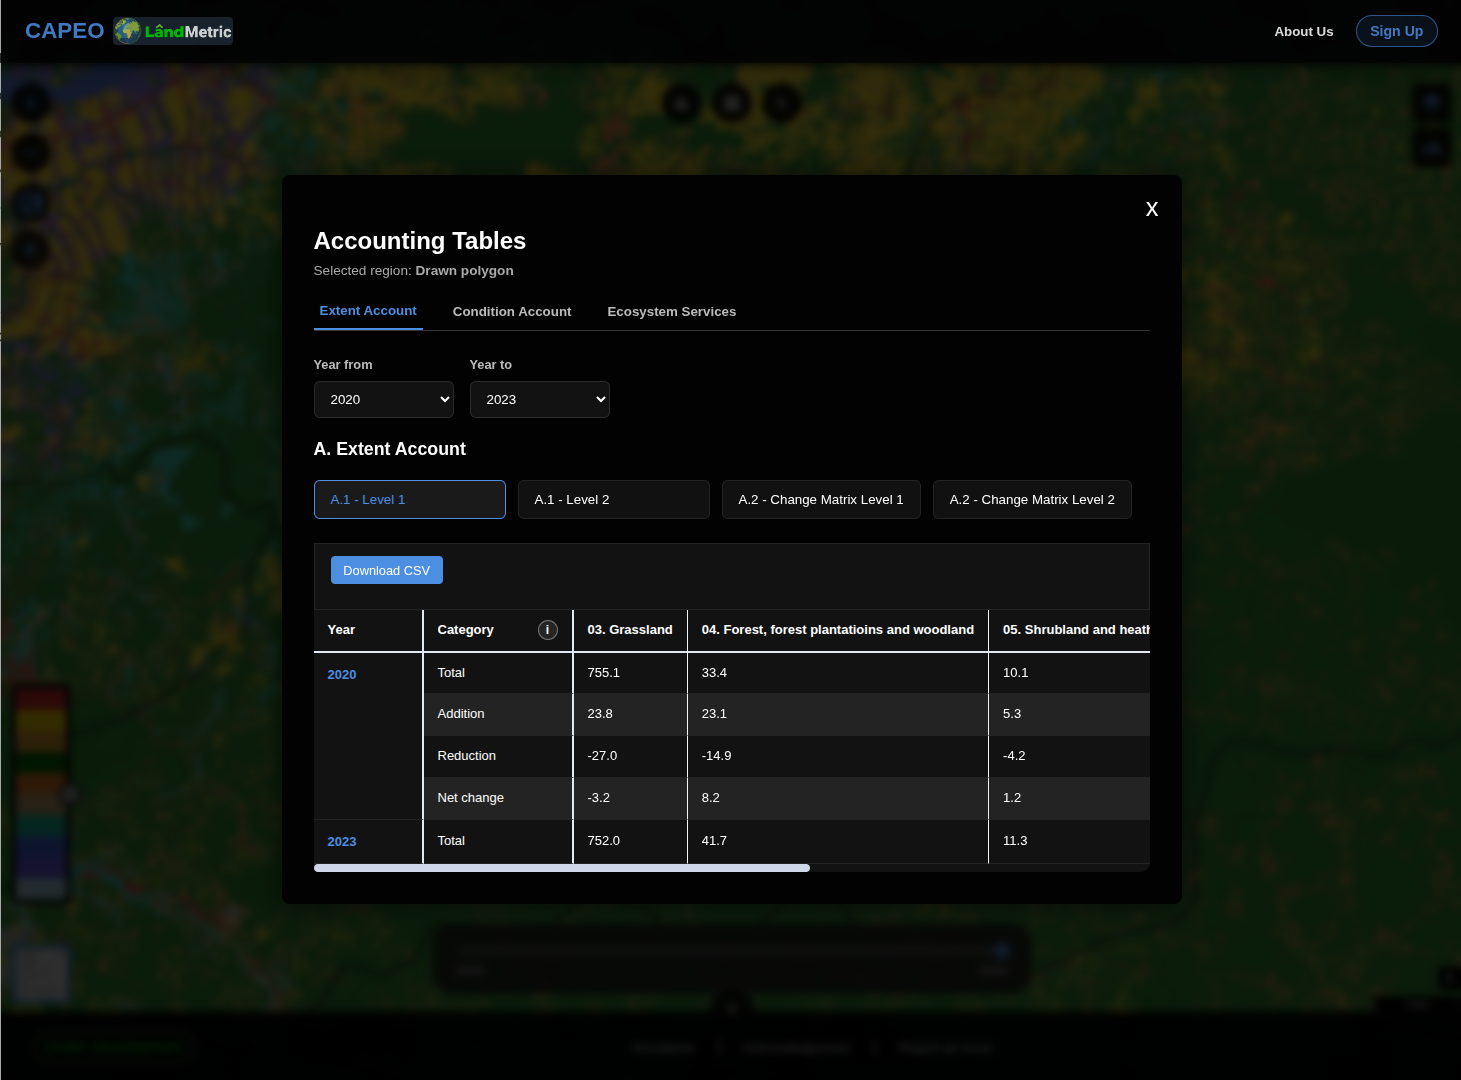
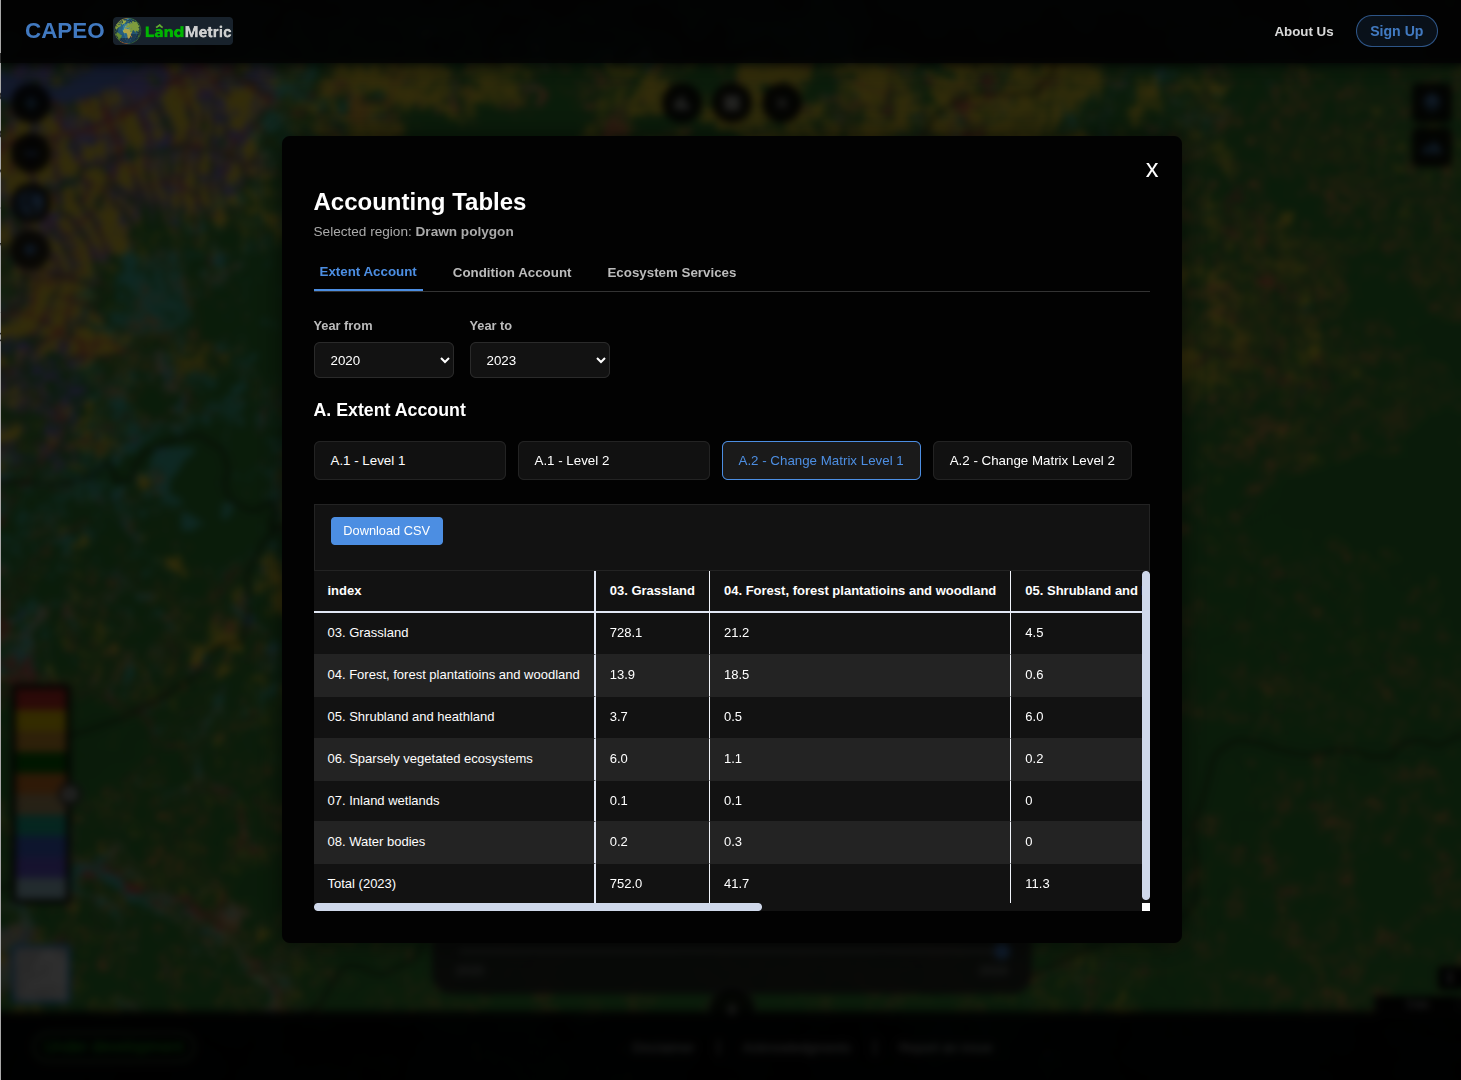
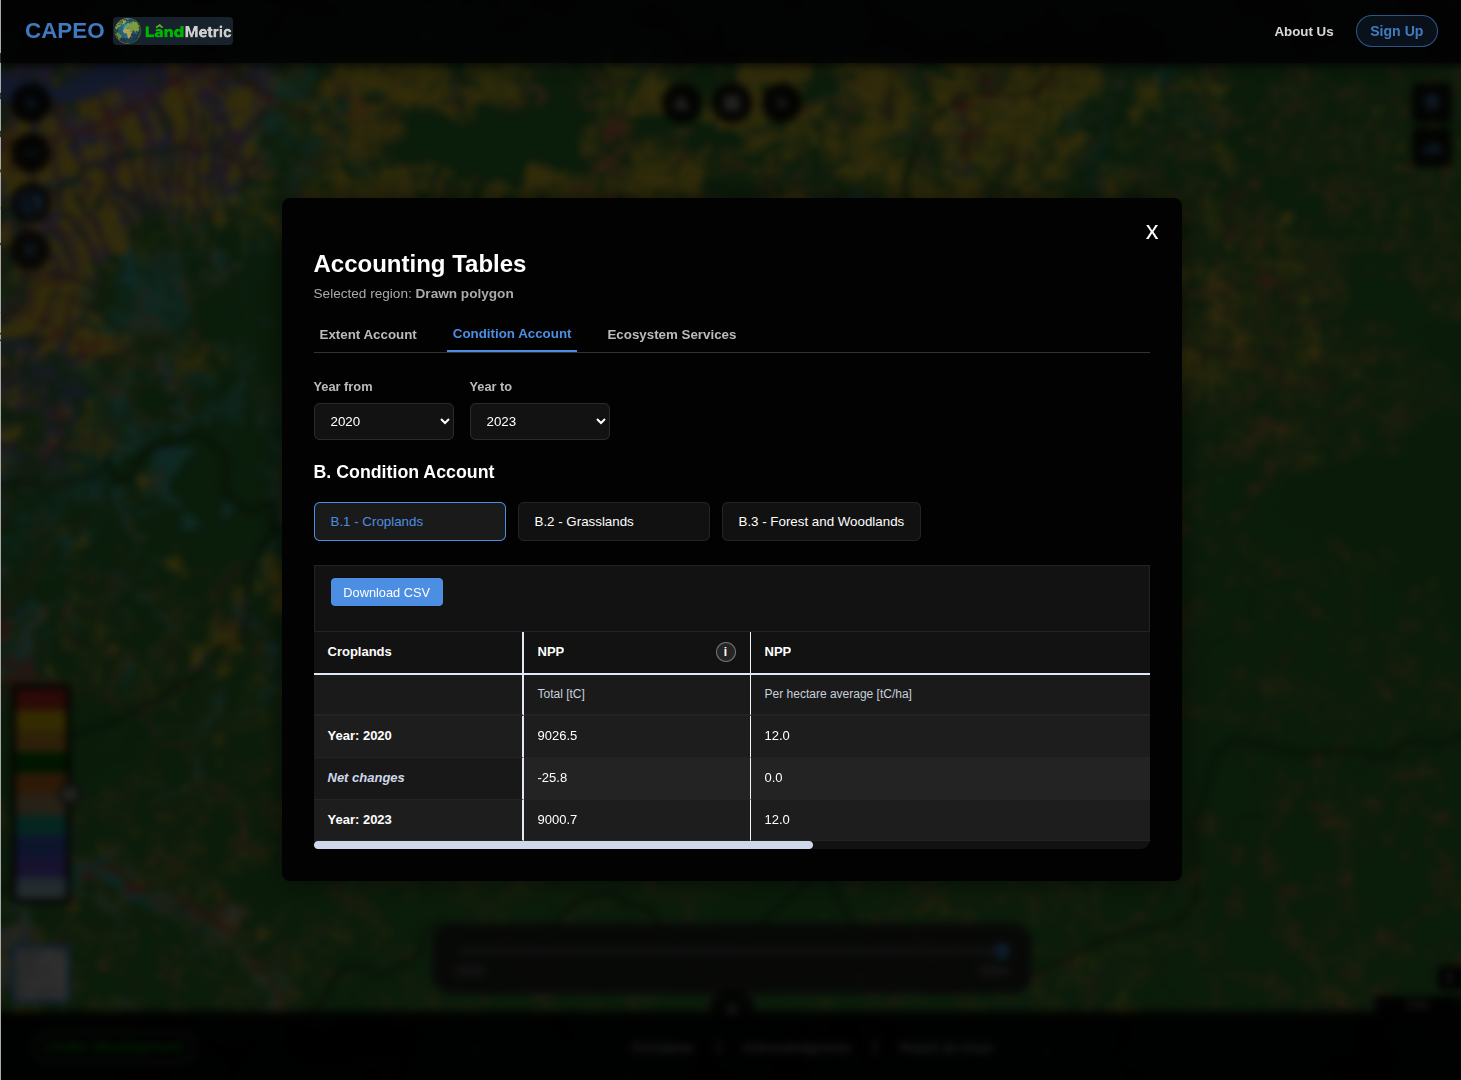
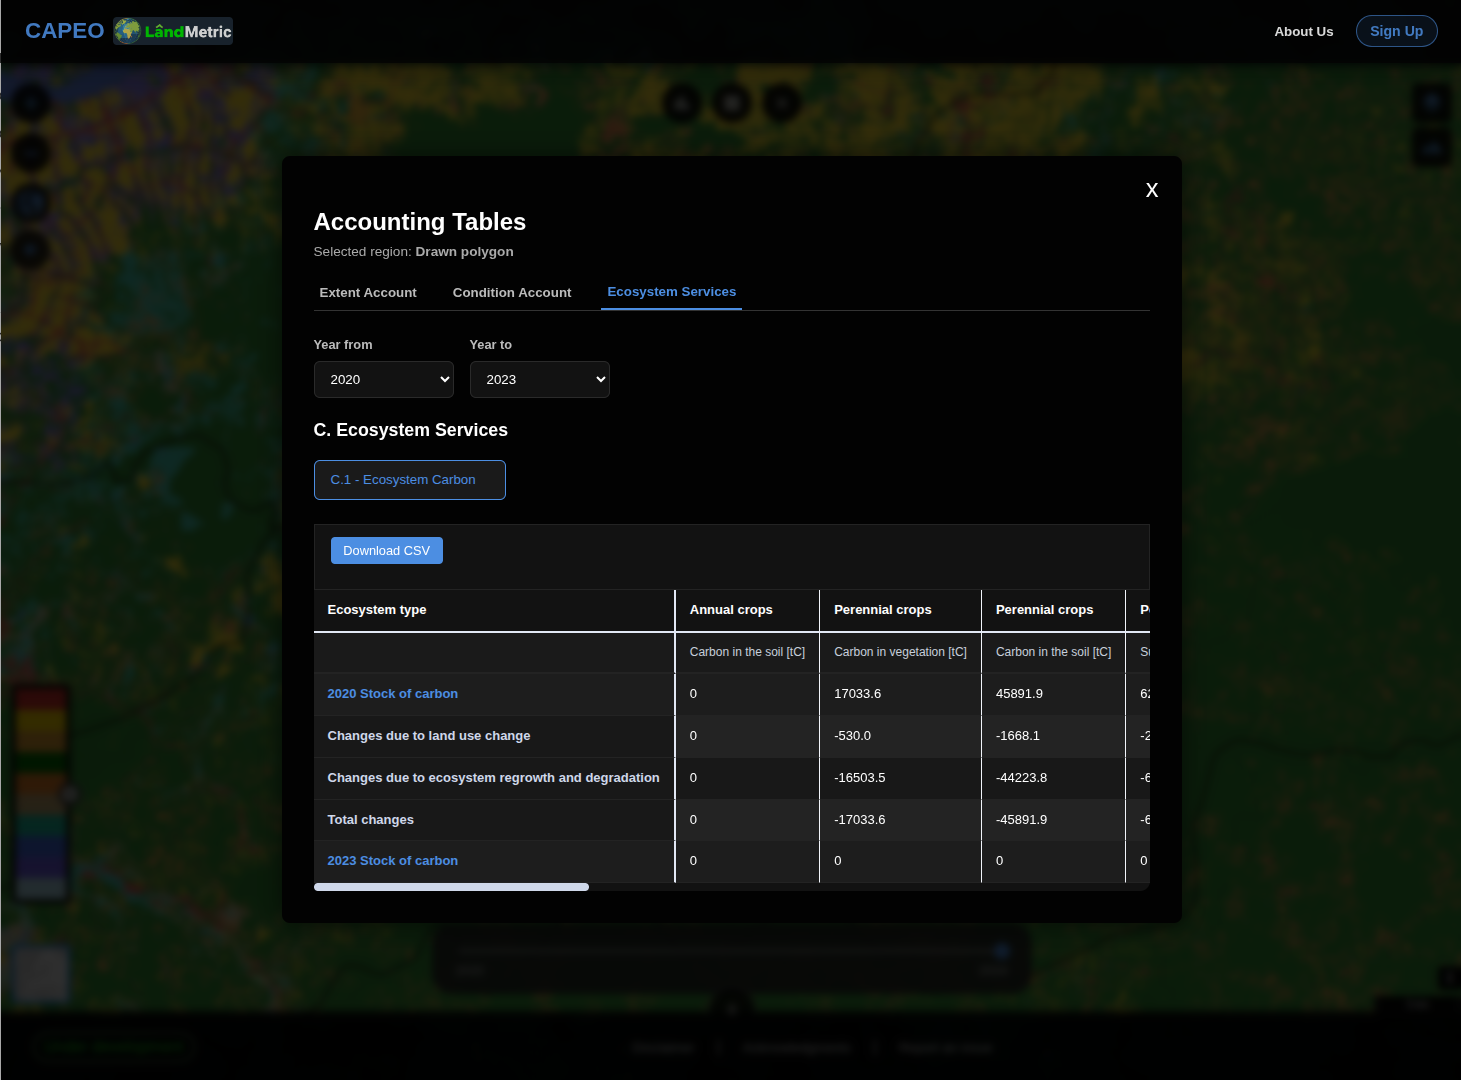
After selecting a region (via Select Area, Draw Area, or Area Comparison), click the list-shaped Accounting tables icon in the toolbar above the result panel. This opens a modal with three tabs, each covering a different type of account. Data in the tool is organized according to the System of Environmental Economic Accounting (SEEA) – Ecosystem Accounting. SEEA Ecosystem Accounting is increasingly used to analyse natural capital by countries, international organisations and the private sector (see: seea.un.org for details). The format of the accounting tables in LandMetric is directly compatible with the SEEA Ecosystem Accounting.
| Tab | Sub-categories | What it shows |
|---|---|---|
| Extent Account | A.1 – Level 1, A.1 – Level 2, A.2 – Change Matrix Level 1, A.2 – Change Matrix Level 2 | Area (ha) per land-cover class per year, broken into Total / Addition / Reduction / Net change. The Change Matrix views show a from → to transition table between classes. |
| Condition Account | B.1 – Croplands, B.2 – Grasslands, B.3 – Forest and Woodlands | Ecosystem condition indicators — e.g. for Forest and Woodlands: AGB (above-ground biomass) and NPP (net primary production), as totals and per-hectare averages, with year-over-year net change. |
| Ecosystem Services | C.1 – Ecosystem Carbon | Carbon stock (in soil and vegetation) by ecosystem type, including changes due to land-use change versus regrowth/degradation. |
Every table has a Download CSV button so you can take the exact numbers into your own spreadsheet or analysis tool.
You can also adjust the Year from / Year to range at the top of the modal to shorten or extend the comparison period.
Tip: if your selected area is larger than 100,000 hectares, real-time accounting isn't available yet — see Tools → Select Area for details on this limit.
Maps & Charts
Next to the Accounting tables icon, a bar-chart icon opens the Polygon query view — a visual, year-by-year breakdown of land-cover composition for your selected area, without needing to open the full accounting modal.
- Use the dropdown in the top-left of the chart to switch between Area (ha) and Percent (%).
- Hover over any bar to see an exact per-class breakdown (in hectares) for that year.
- The color legend above the chart lists every land-cover class present in your selected area.
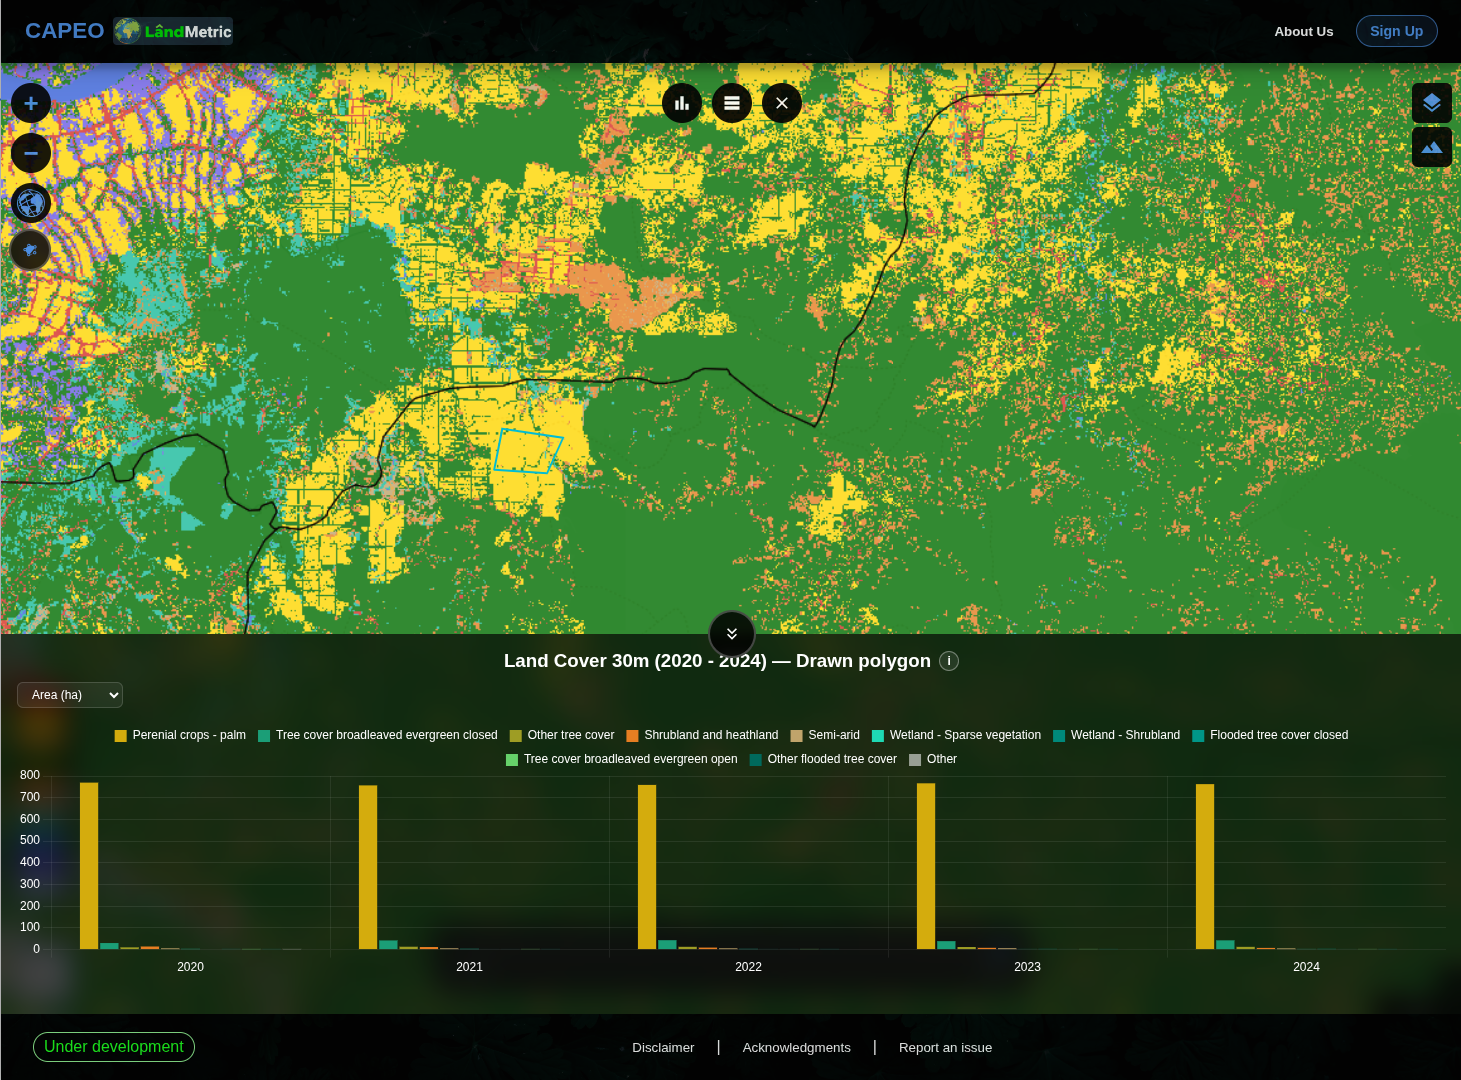
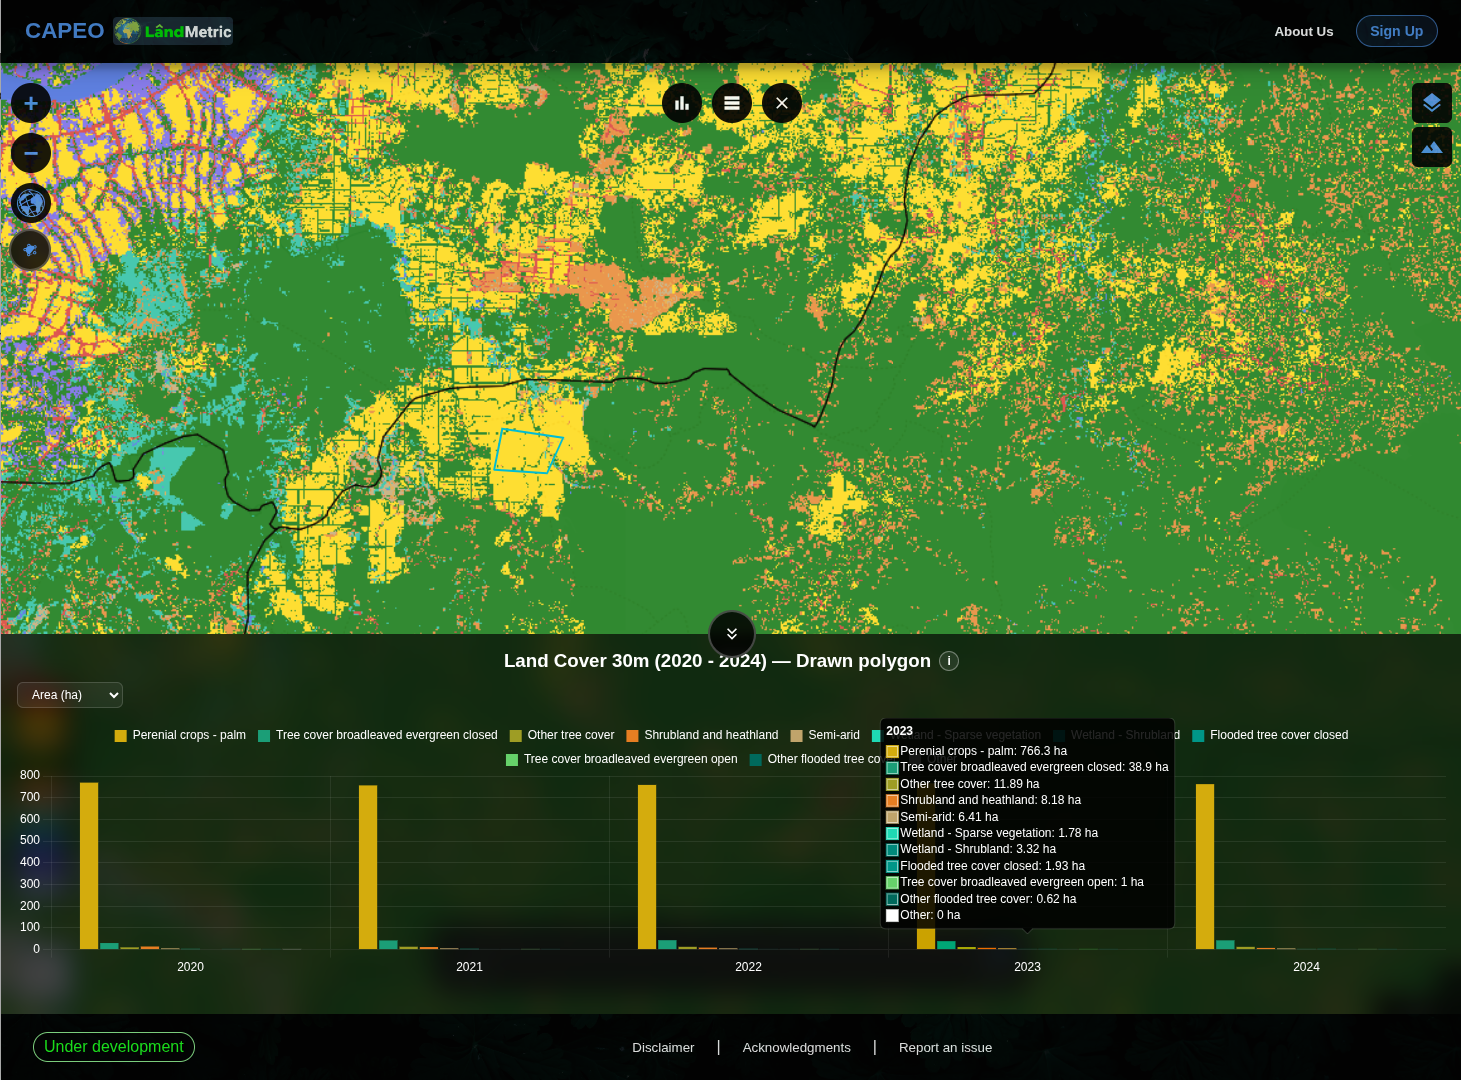
Note: Charts aren’t limited to on-screen visualization—you can also export them as images. Click Export graph to download the chart as a PNG file.
Next: Examples of Analysis →