Example of Analysis — Palm Oil Expansion in Sorong District, Papua Barat Province, Indonesia
Palm oil is an important commodity and has created important economic benefits. At the same time, palm-oil-driven deforestation is a significant environmental concern in several countries including Indonesia. To illustrate how the Landmetric tool can support the analysis of deforestation, this example examines the expansion of oil-palm cover in Sorong Regency, Papua, between 2020 and 2024.
1. Select the Area of Interest
Select the Land Cover 30 m layer by clicking the tile on the top right hand side and then click on ‘Ecosystem Extent’, to establish the underlying raster map that provides the thematic data. You can also select the 10m map which is more detailed and more accurate, but this map is only available for one year so it is less useful for analysing deforestation.
Next, click on the second tile on the top right hand site, go to ‘ Administrative Boundaries’ and click on district boundaries. This will project the administrative boundaries at the District level on top of the thematic map. Now zoom in one the western part of Papua (Bird's Head Peninsula). Hovering the mouse on the map for approximately three seconds will display the administrative names of each district (or Regency). Use the mouse to select Sorong Regency.
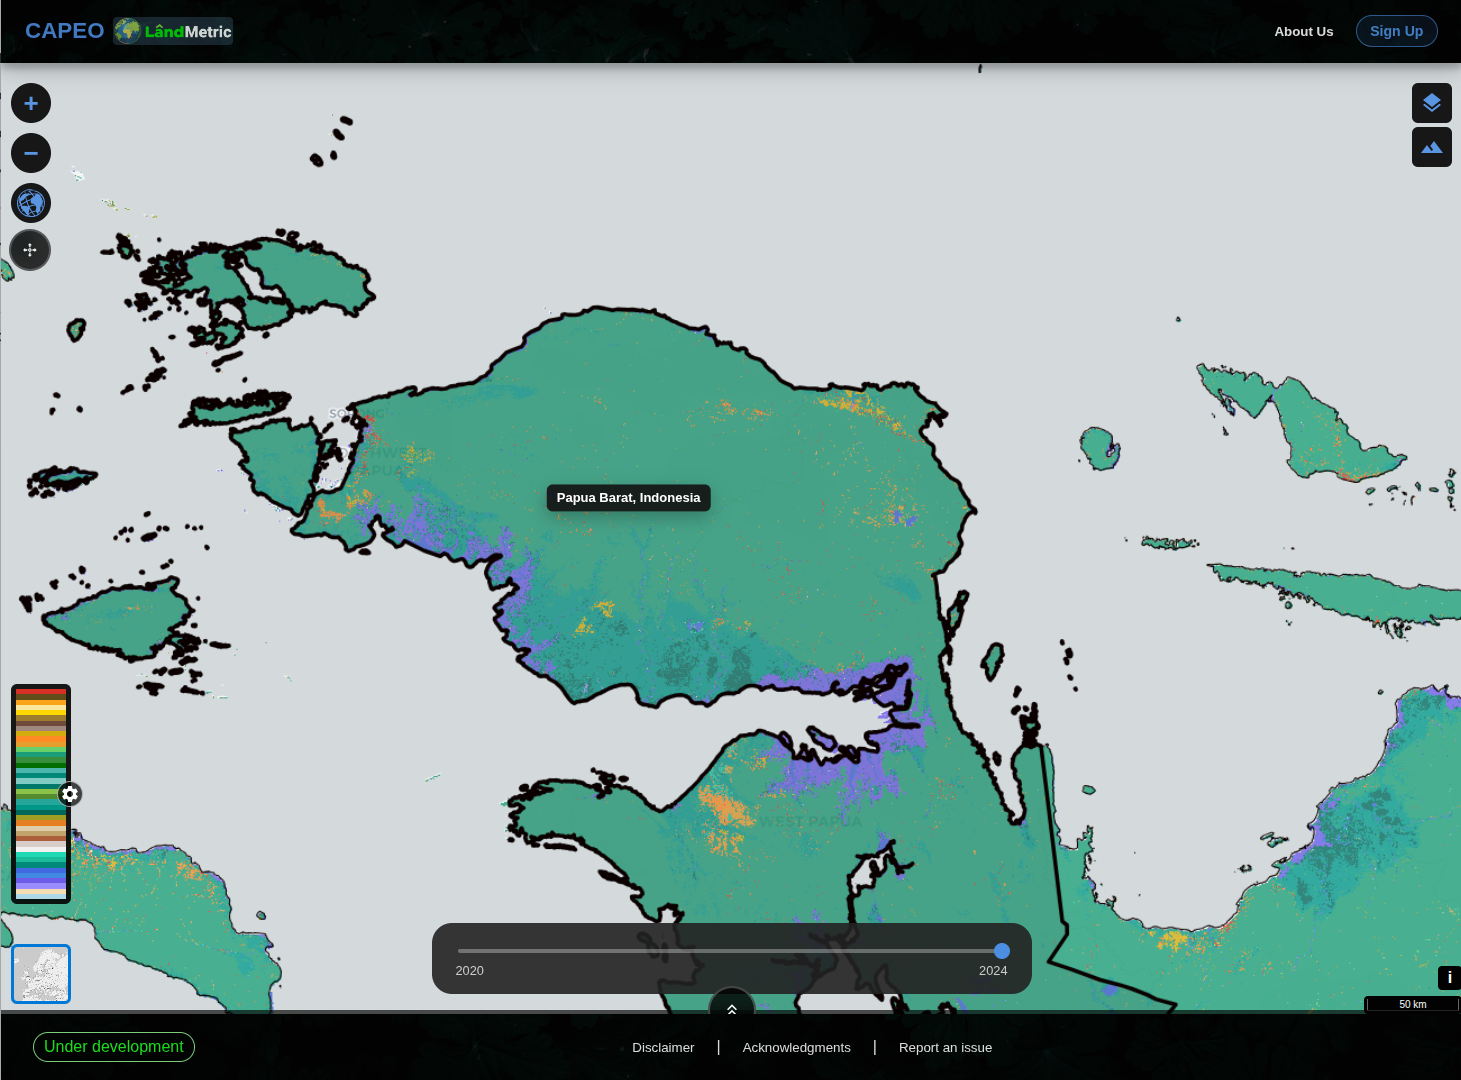
2. Visually compare Land Cover Across Years
Compare the land-cover maps for 2020 and 2024. Areas classified as tree cover in 2020 appear as oil palm in 2024, indicating a possible land-cover transition. Note that for reasons of clarity we are now showing the admin boundaries at the Provincial level.
| 2020 | 2024 |
|---|---|
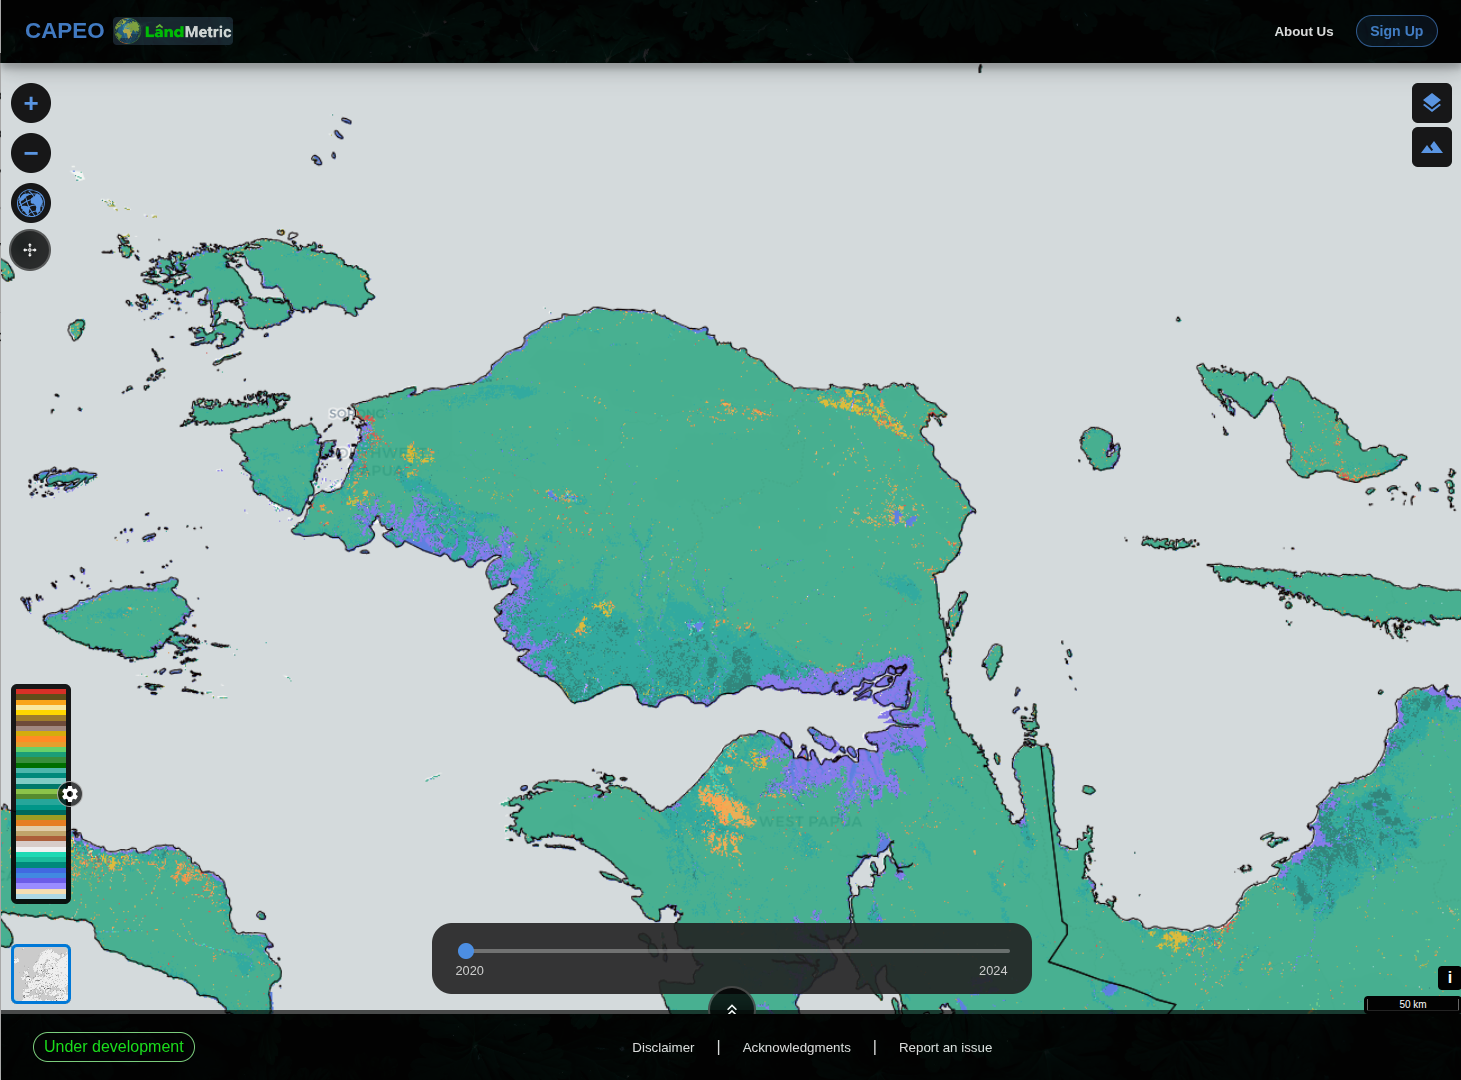 | 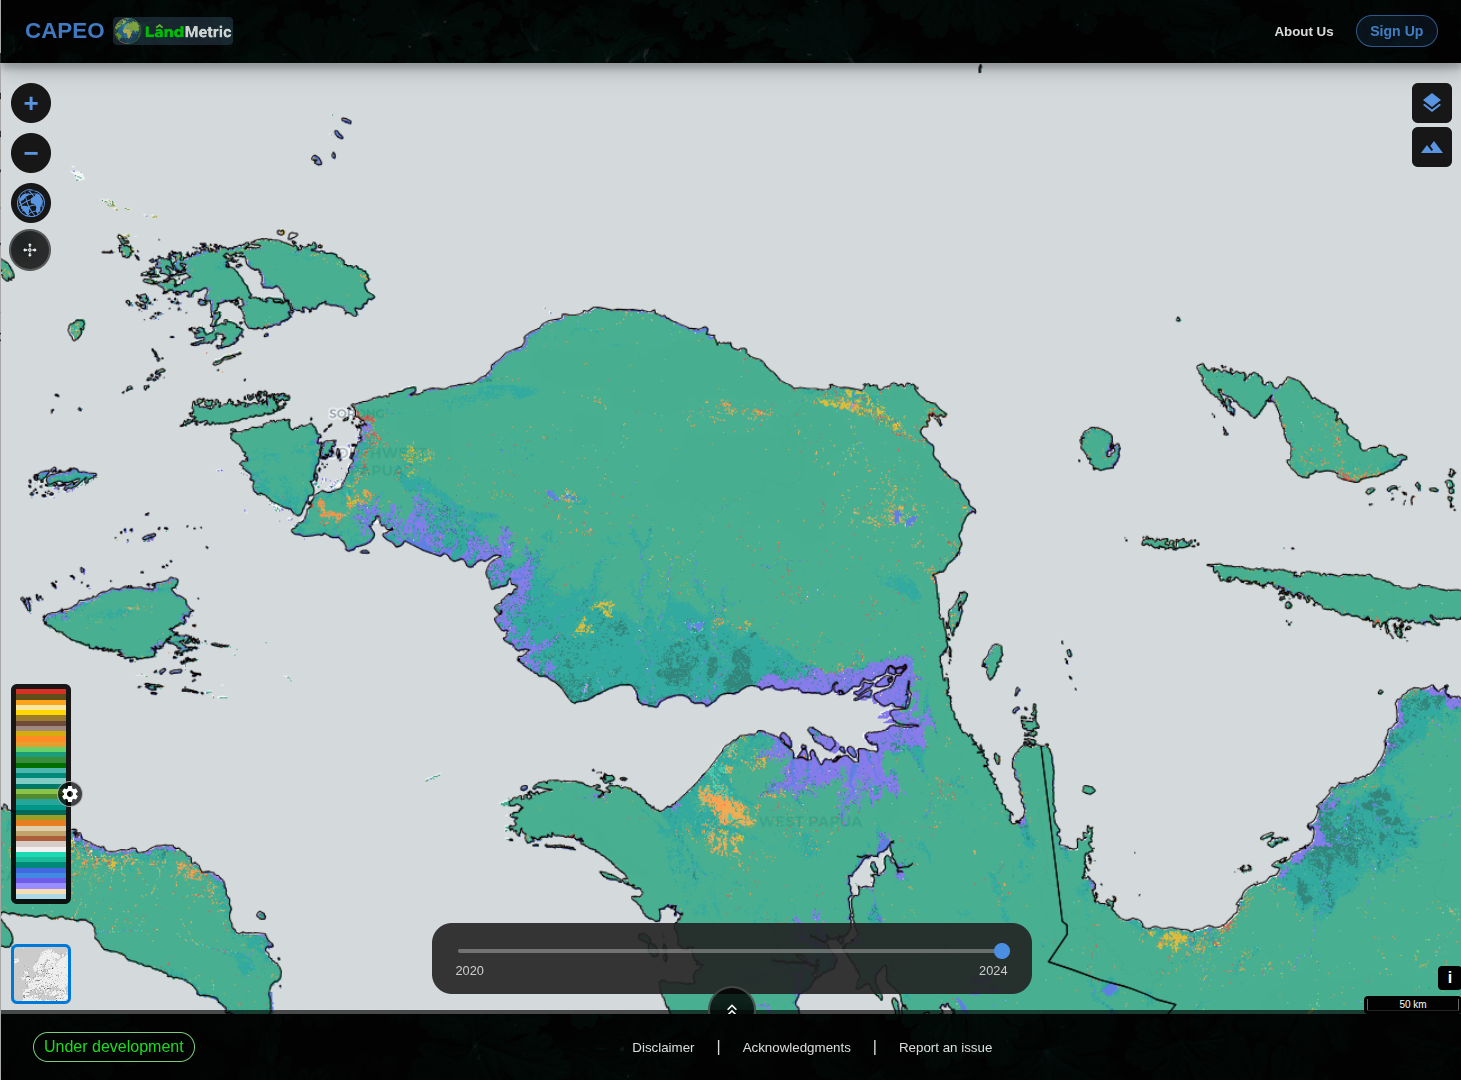 |
The following animation shows the land-cover changes between the two years:
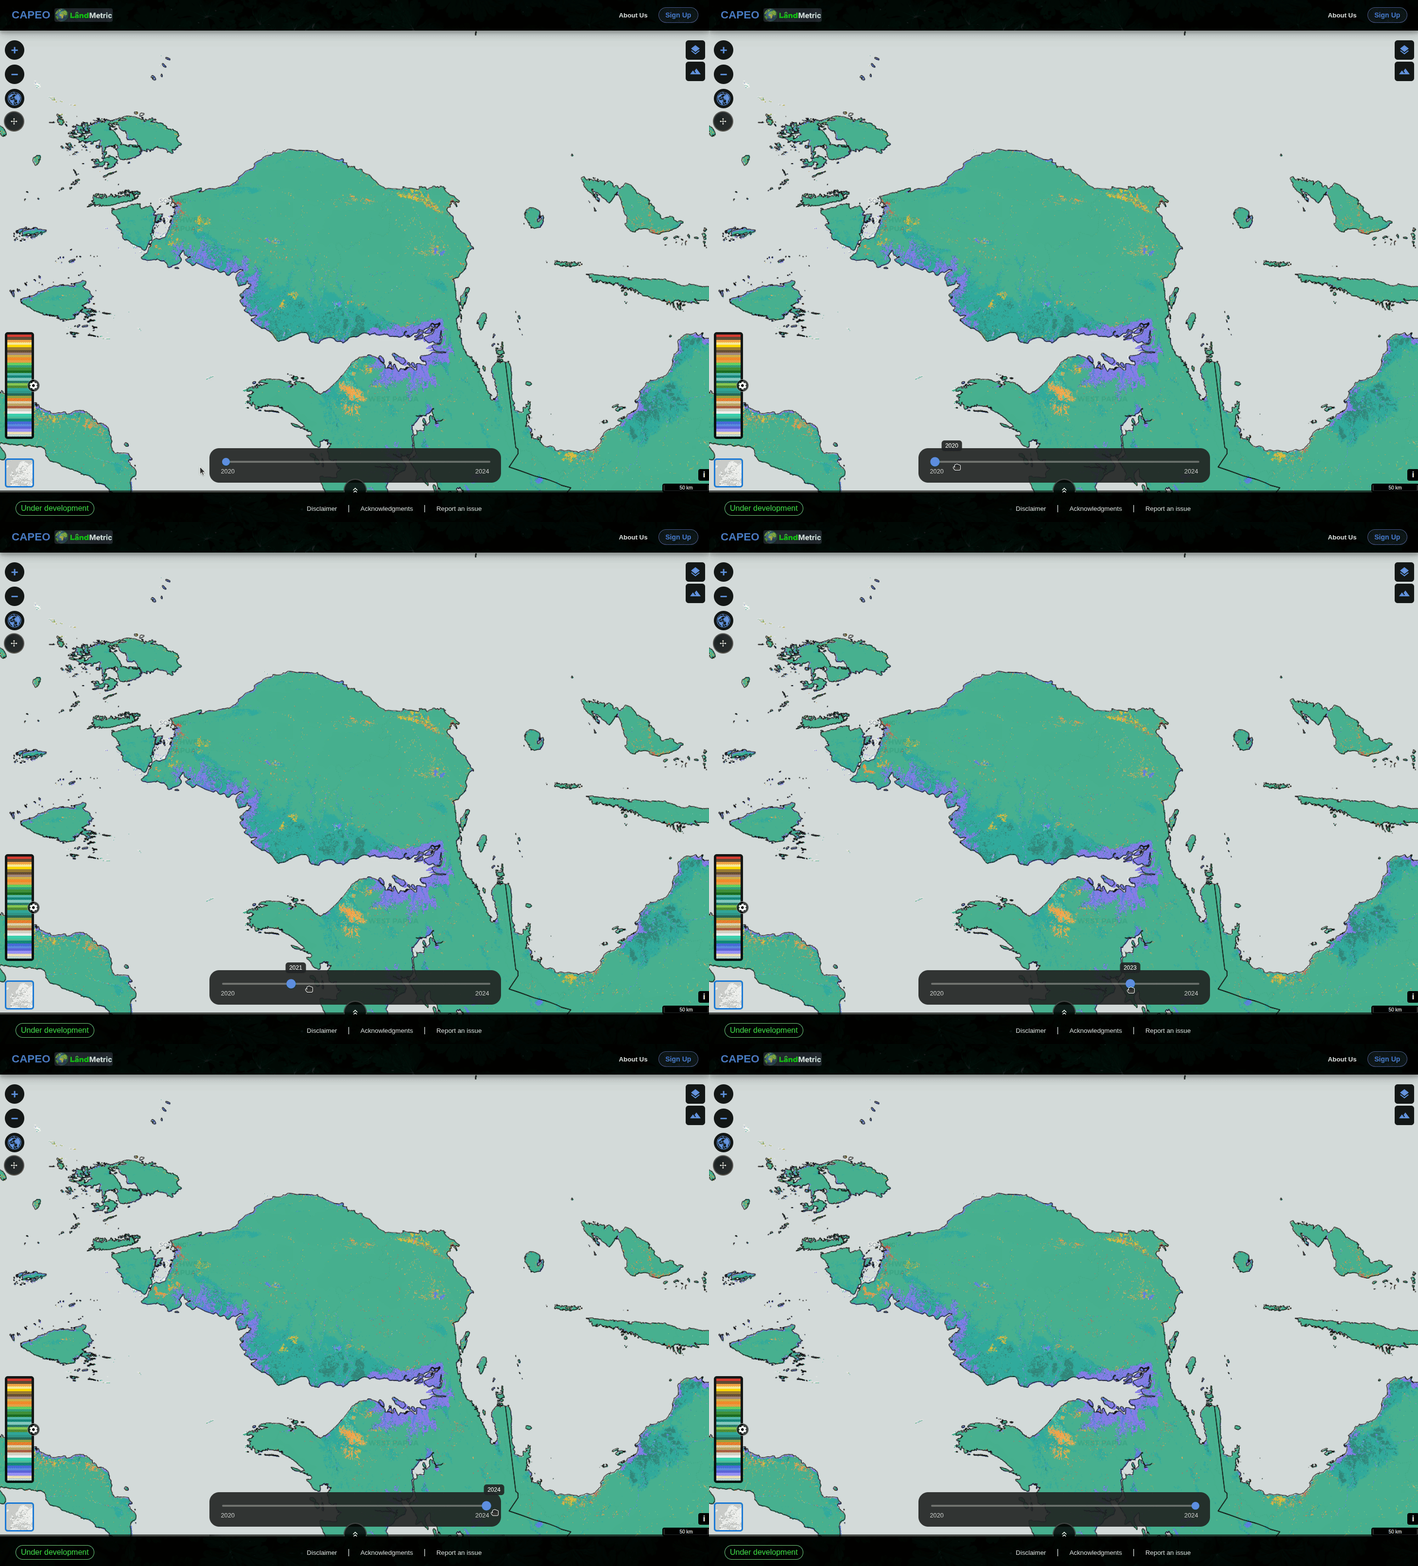
3. Analyse the land cover change in Sorong District
The Landmetric tool allows you to easily retrieve data on land cover change between 2020 and 2024 for every administrative area (i.e. every district, province or country). As an example we will show this for Sorong District. This tile  on the left hand side allows you to do various statistical and trend analysis of the data in the tool. Click on the tile. Now click on the tile
This will allow you to select any administrative area from the currently displayed administrative boundary map. You can now select Sorong District. It will show a graph with the land cover from 2020 to 2024. Hoovering the mouse over each year’s graph will show the exact numbers. 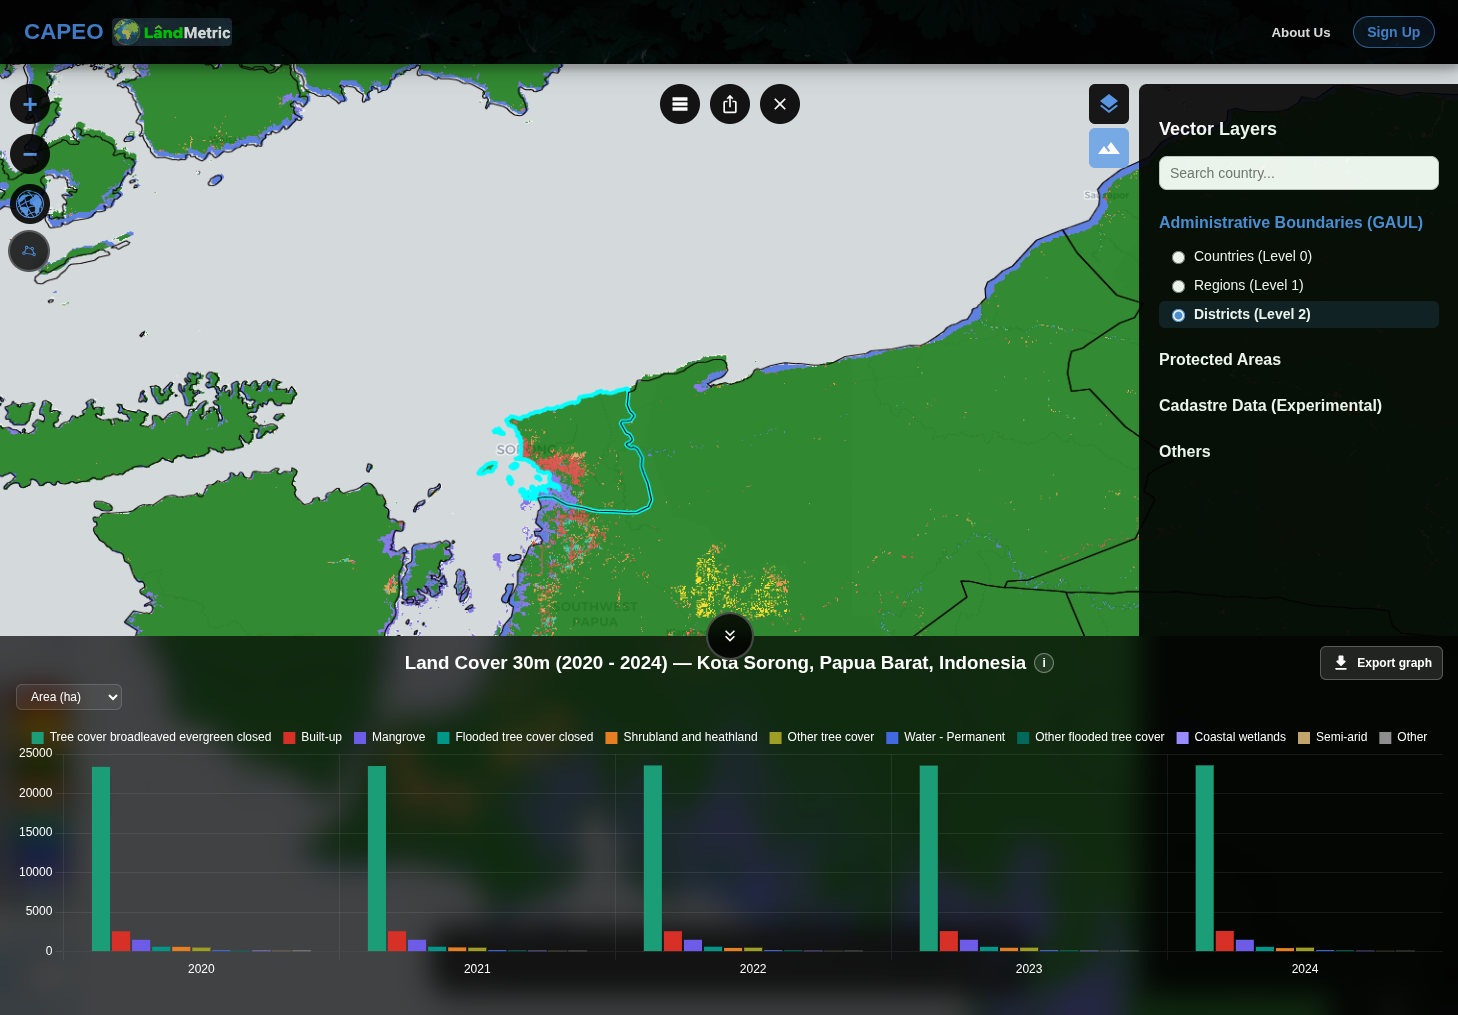
With ‘ Export Graph’ you can export the graph to a png file that you can insert in a document.
However you can also download the data itself. You will then have to create an accounting table, using the three bars on the top. The left hand tile  creates the accounting table, that you can export with the ‘ Download csv’. Command. To analyse land cover change you need to select the ‘ Extent Account’ – Accessing the condition or services account allows analysing other types of thematic data for the selected area of interest. A CSV file can be imported in Excel (note: the CSV file needs to be imported, it cannot be directly opened in Excel).

4. Alternatively, you can analyse a Custom-defined Area
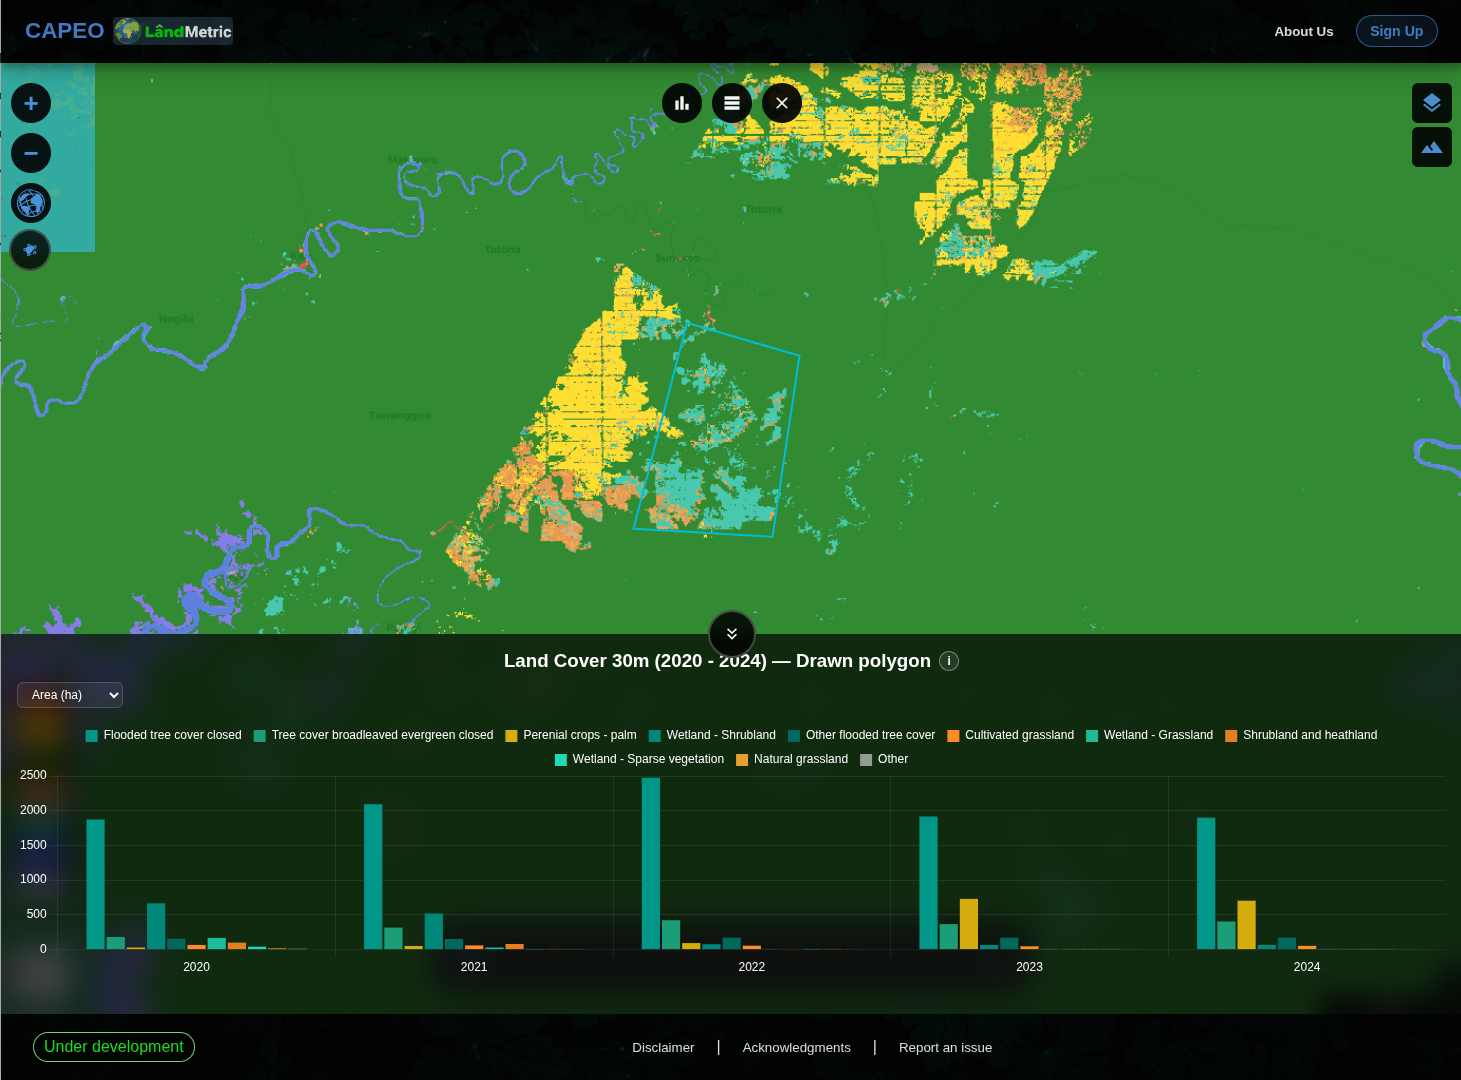
Use the Draw Area tool to create a polygon around the area of interest. The draw area command can be found here:  (second tile from the right). Click on this tile and then use the mouse to define your area of interest. Then click on the check mark
  - first tile will from the left - to finish the polygon. Use the same procedure as described in the previous section to bring up the graph, or to show and download accounting tables that give the numbers behind the graph.
The resulting bar chart shows that oil-palm cover increased between 2020 and 2024, while tree cover decreased.
5. Reviewing and Exporting the Accounting Tables
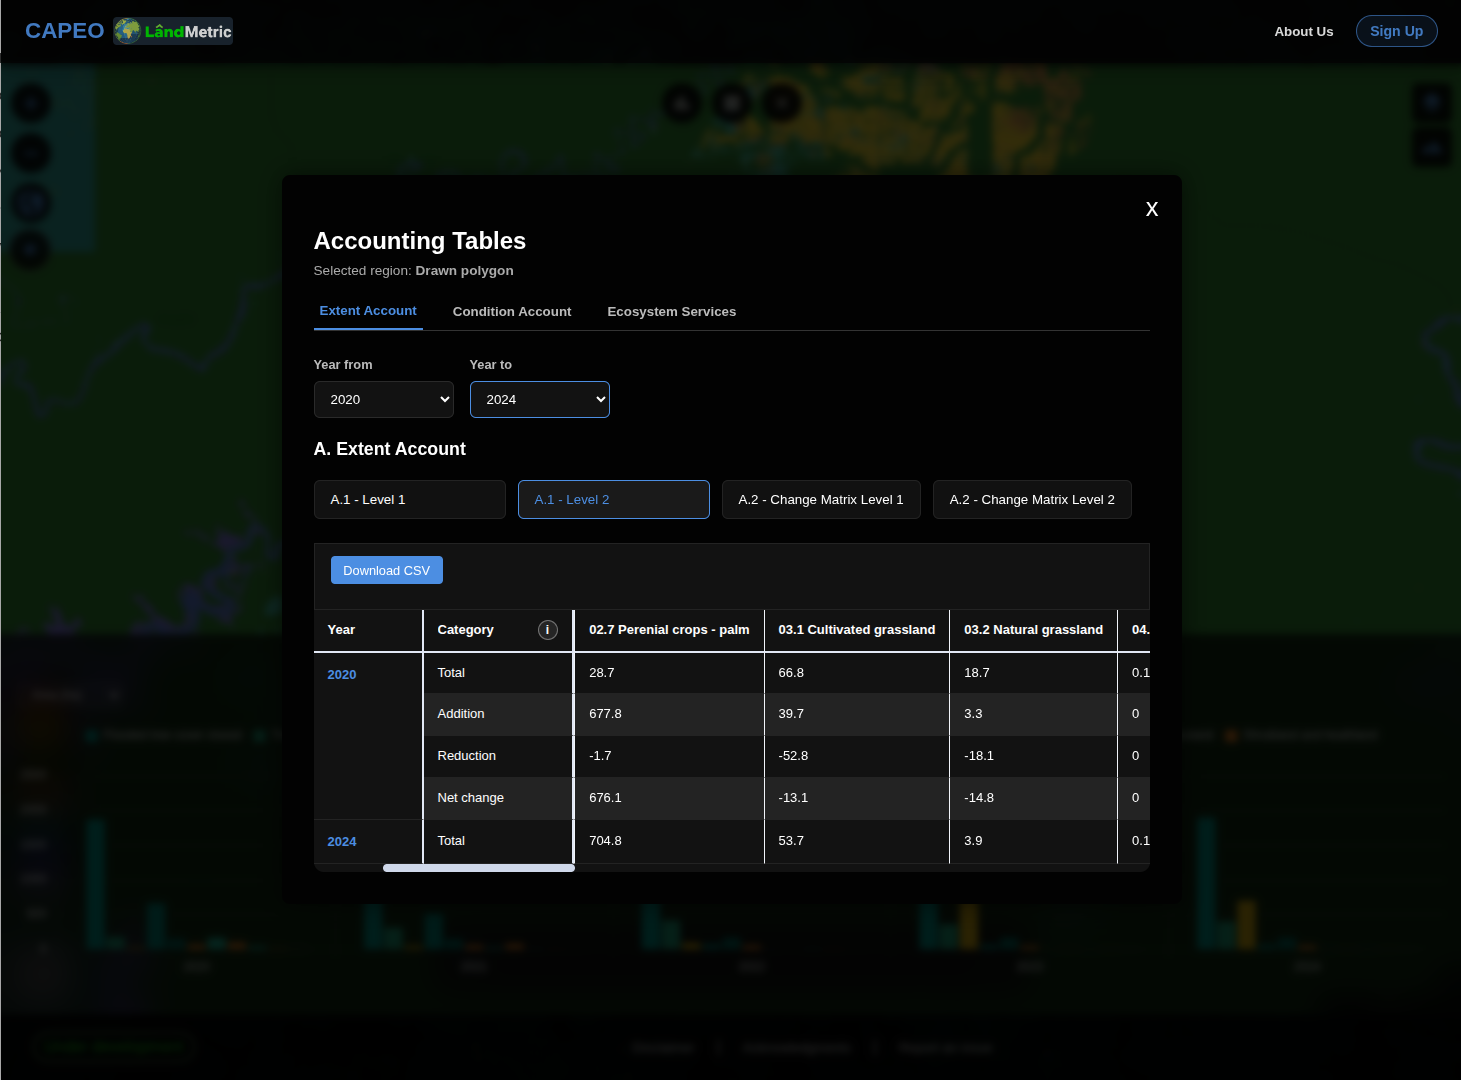
Export the accounting tables to examine the land-cover changes in more detail.
Extent Account
The extent account reports an increase in total oil-palm area from 28.7 in 2020 to 704.8 in 2024.
Ensure that the unit of measurement is stated as shown in the exported table.
Change Matrix
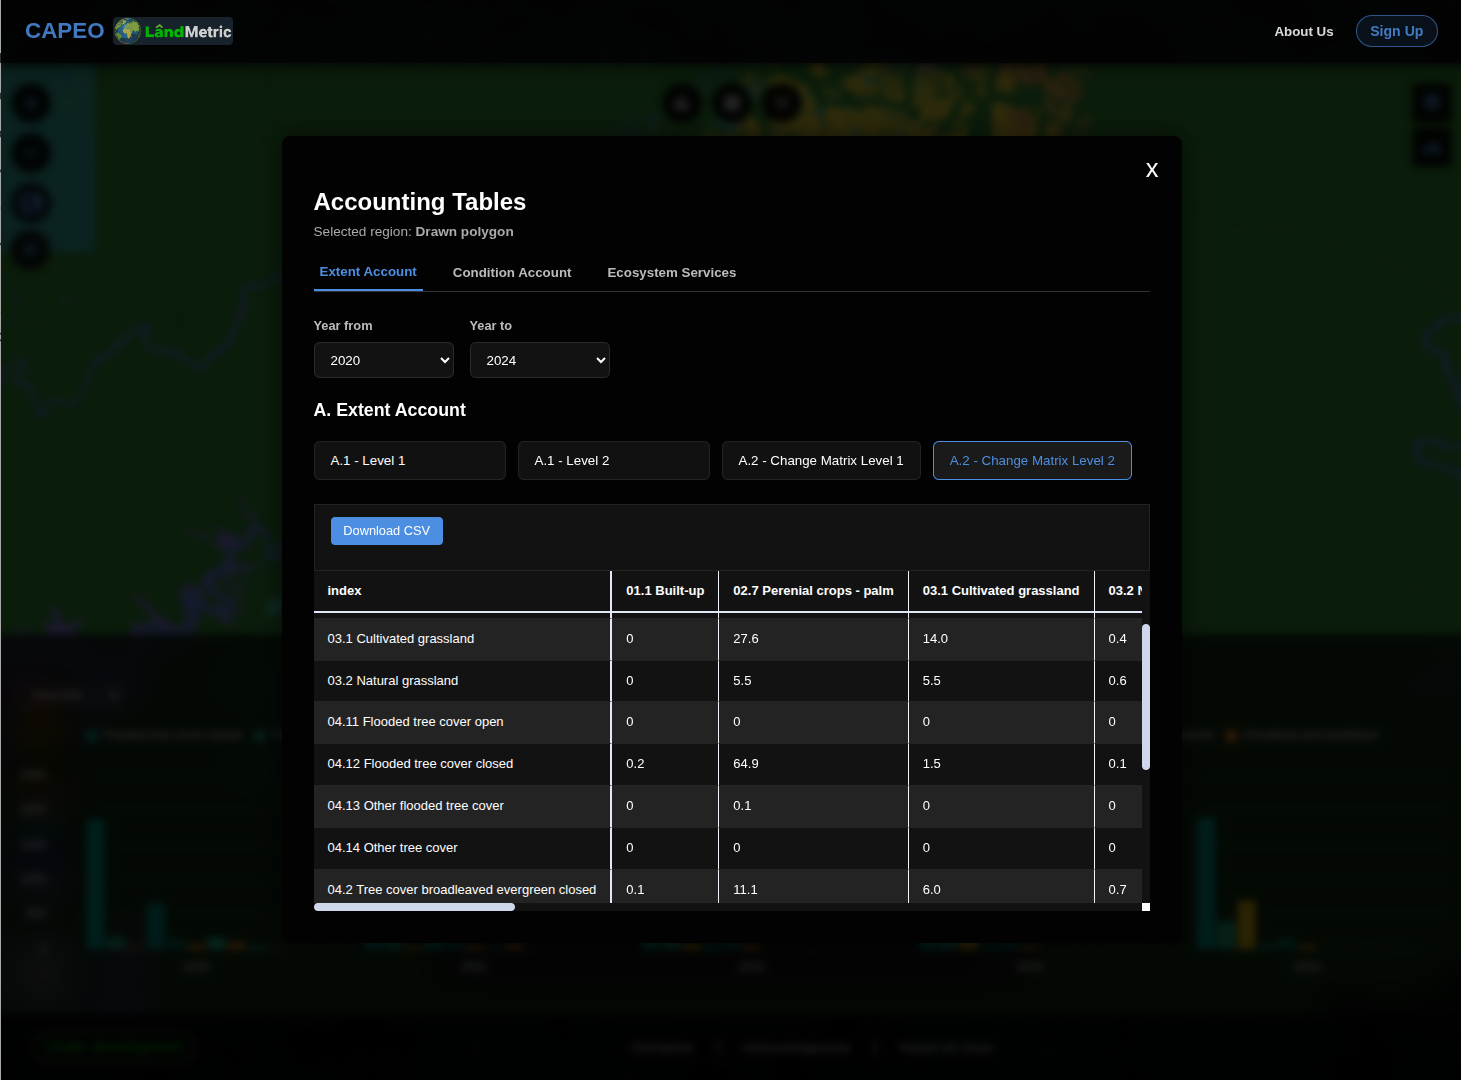
The change matrix shows a similar pattern, with a substantial area transitioning from tree cover to oil palm.
6. Validate the Results with Esri Wayback
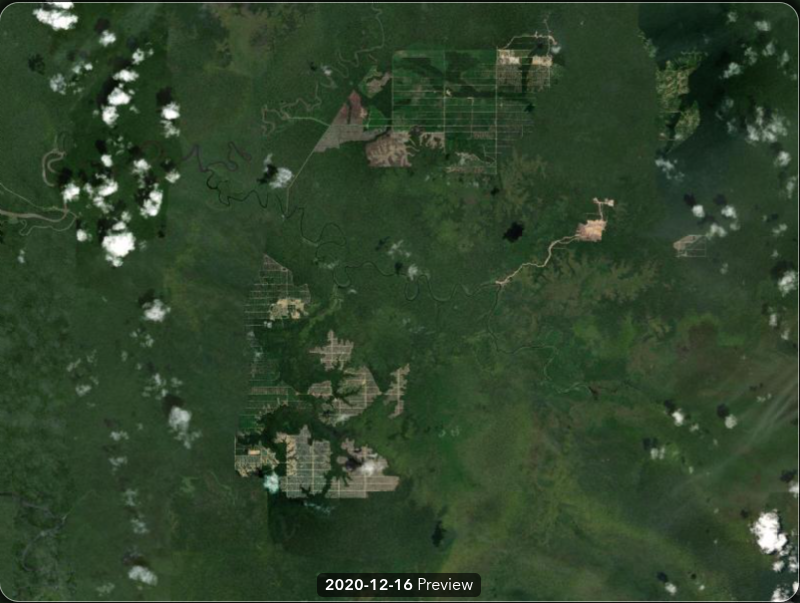
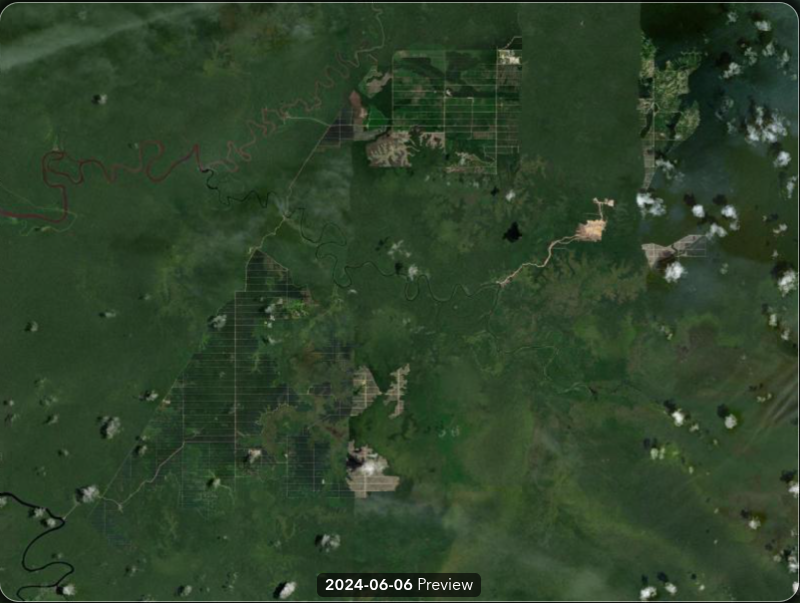
Click the Esri Wayback button to open historical satellite imagery for the same location and zoom level. This button can be found on the left hand side, and looks like: 
Compare imagery from 2020 and 2024 to independently assess the observed transition from forest or tree cover to oil-palm plantations.
| 2020 imagery | 2024 imagery |
|---|---|
 |  |