Example of Analysis — Forest conversion in Halaba District, Snnp Province, Ethiopia
Deforestation affects both economic development and environmental health. In Halaba, SNNP, Ethiopia, tree cover loss has become increasingly evident due to agricultural expansion, shifting cultivation, and other land-use pressures. The Normalized Difference Vegetation Index (NDVI) can serve as an effective indicator for assessing and comparing changes in vegetation cover over time. To illustrate how the Landmetric tool can support this type of analysis, this example examines NDVI changes in Halaba between January 1997 and December 2024.
1. Select the Area of Interest
Select the Normalized Difference Vegetation Index (NDVI) layer by clicking the tile in the upper-right corner of the map, then select Ecosystem Condition to display the underlying raster layer containing the thematic data. Alternatively, type NDVI into the search box to locate the data layer directly. You can adjust the Opacity setting above the search box to change the transparency of the NDVI layer.
Next, click the second tile in the upper-right corner, select Administrative Boundaries, and then choose District Boundaries (Level 2). This will display district-level administrative boundaries on top of the thematic map.
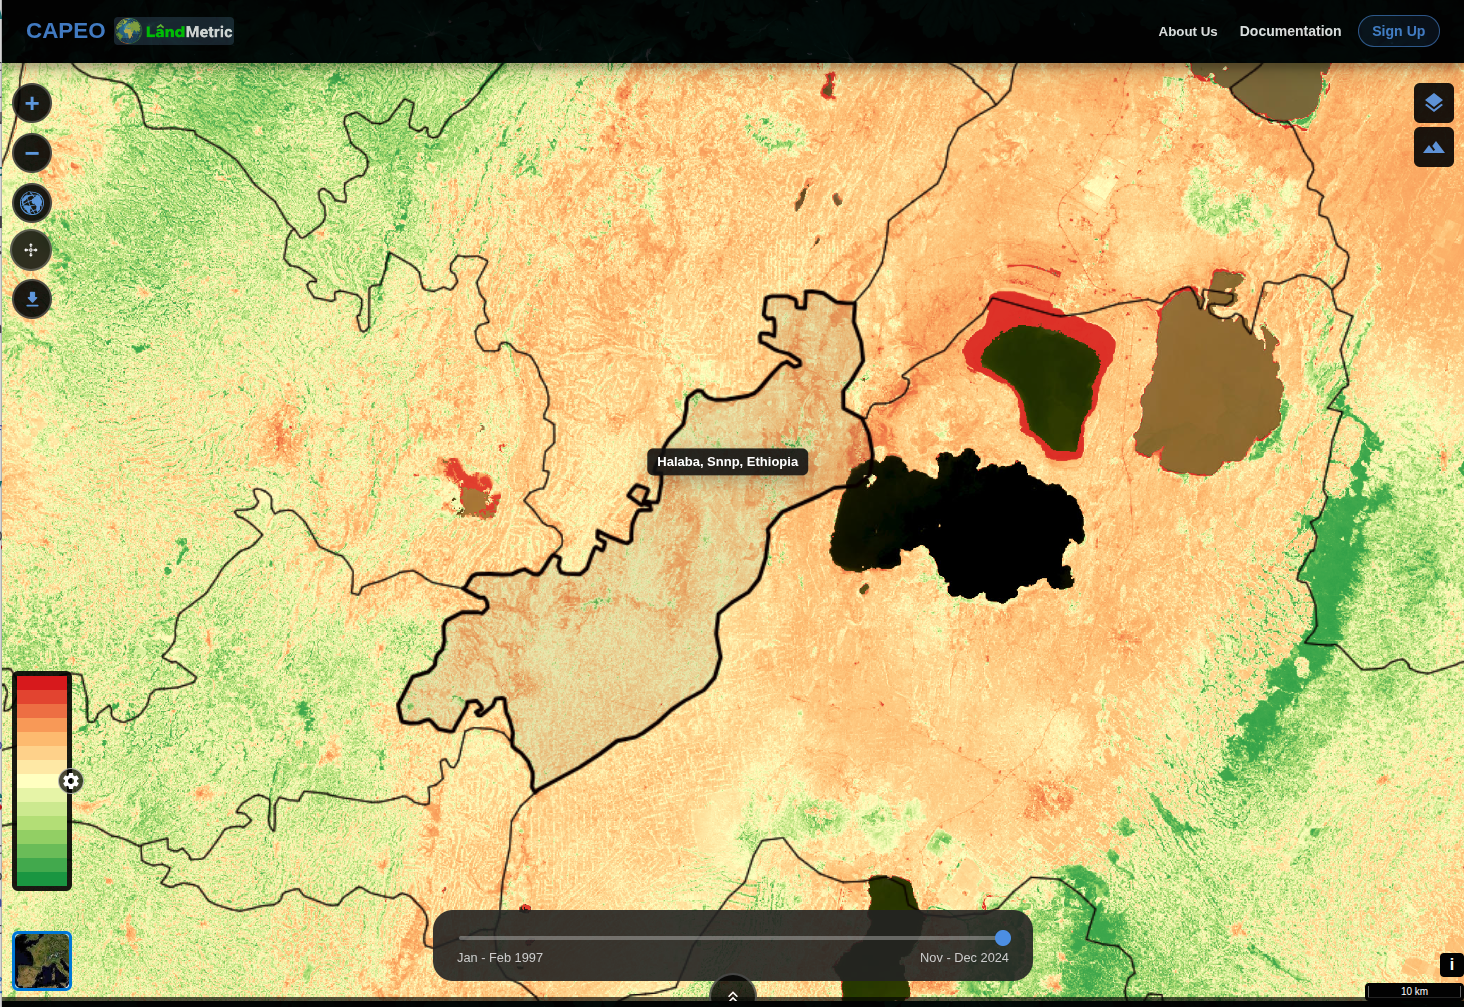
Zoom in to the central part of Ethiopia, where Halaba District is located. Lake Shala and Lake Abijatta lie to the east of this area and can be used as geographic reference points. Hover the cursor over the map for approximately three seconds to display the administrative name of each district (or regency). Then, use the mouse to select Halaba Regency.
2. Visually compare NDVI Across Years
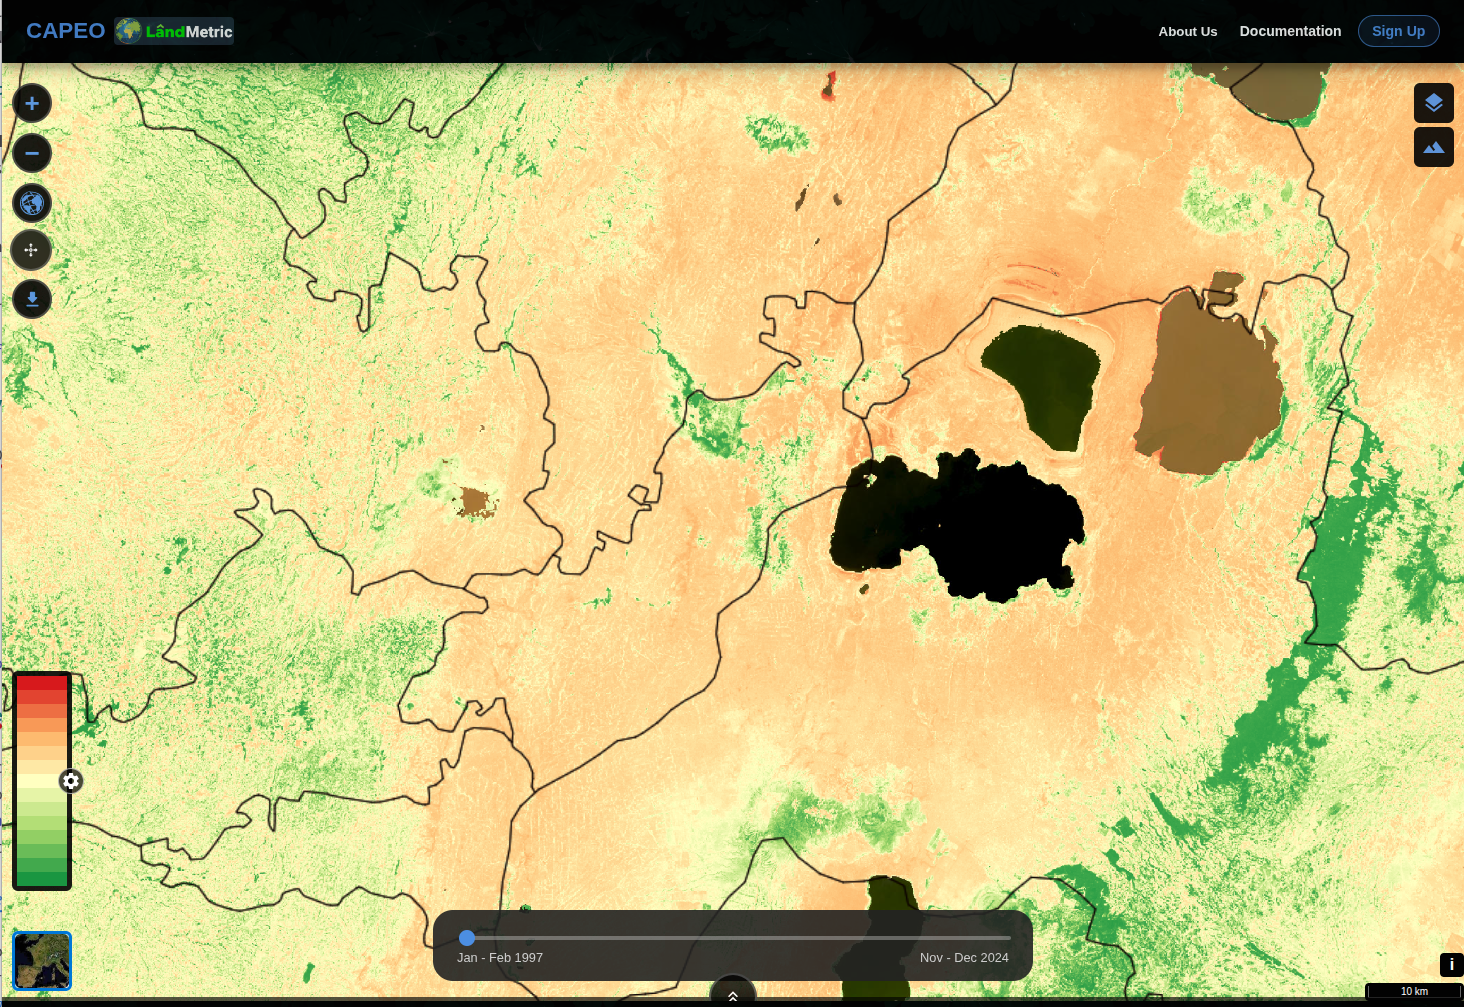
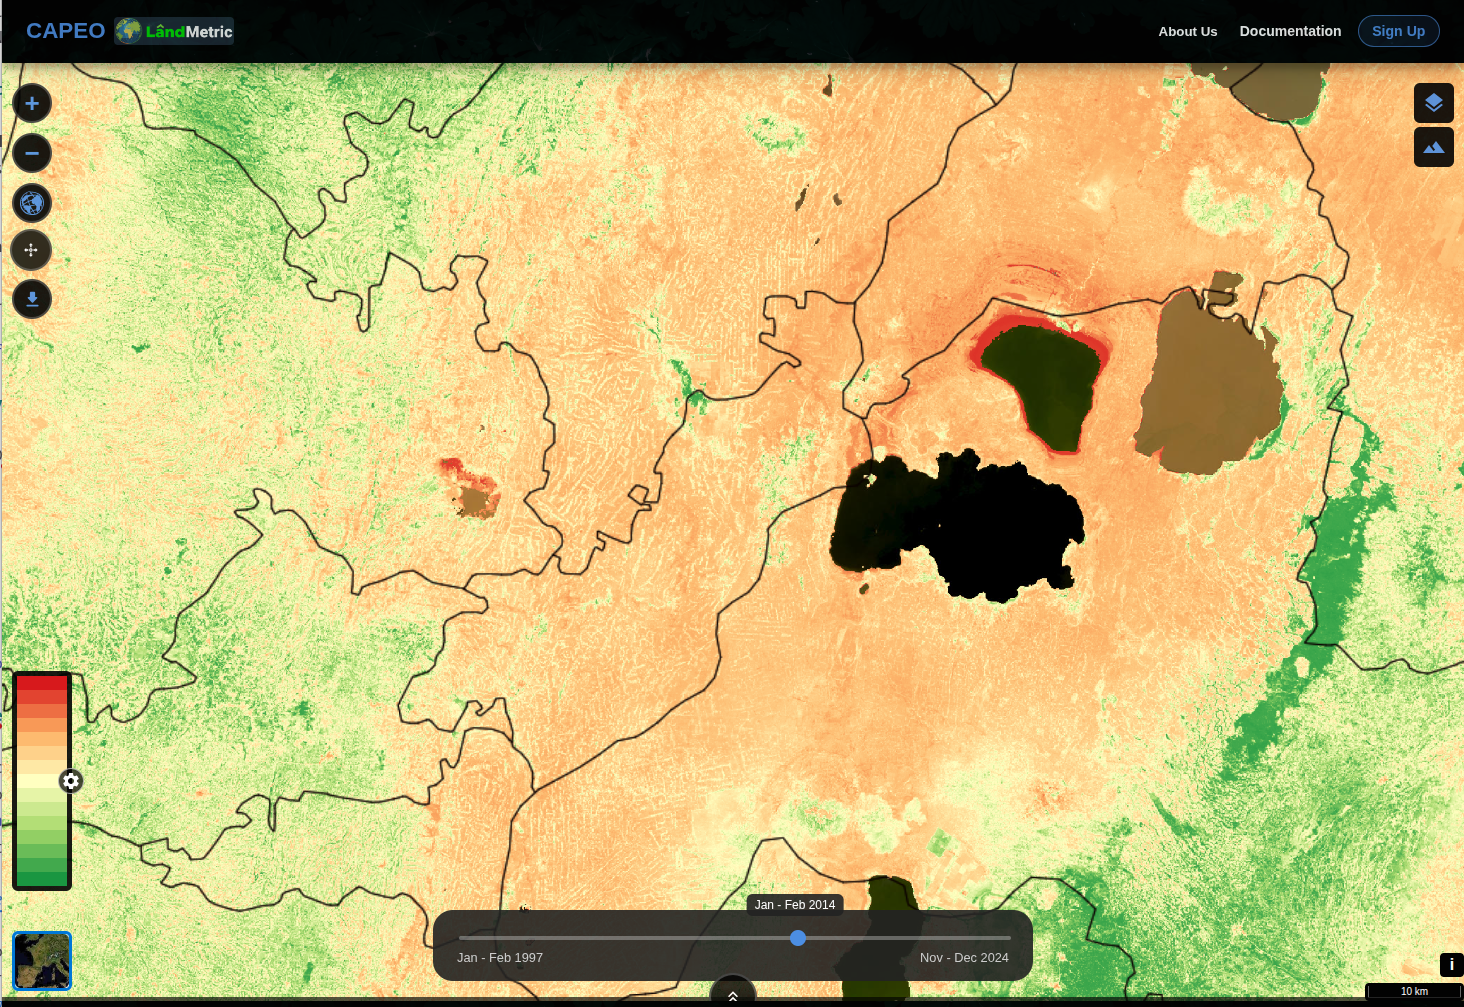
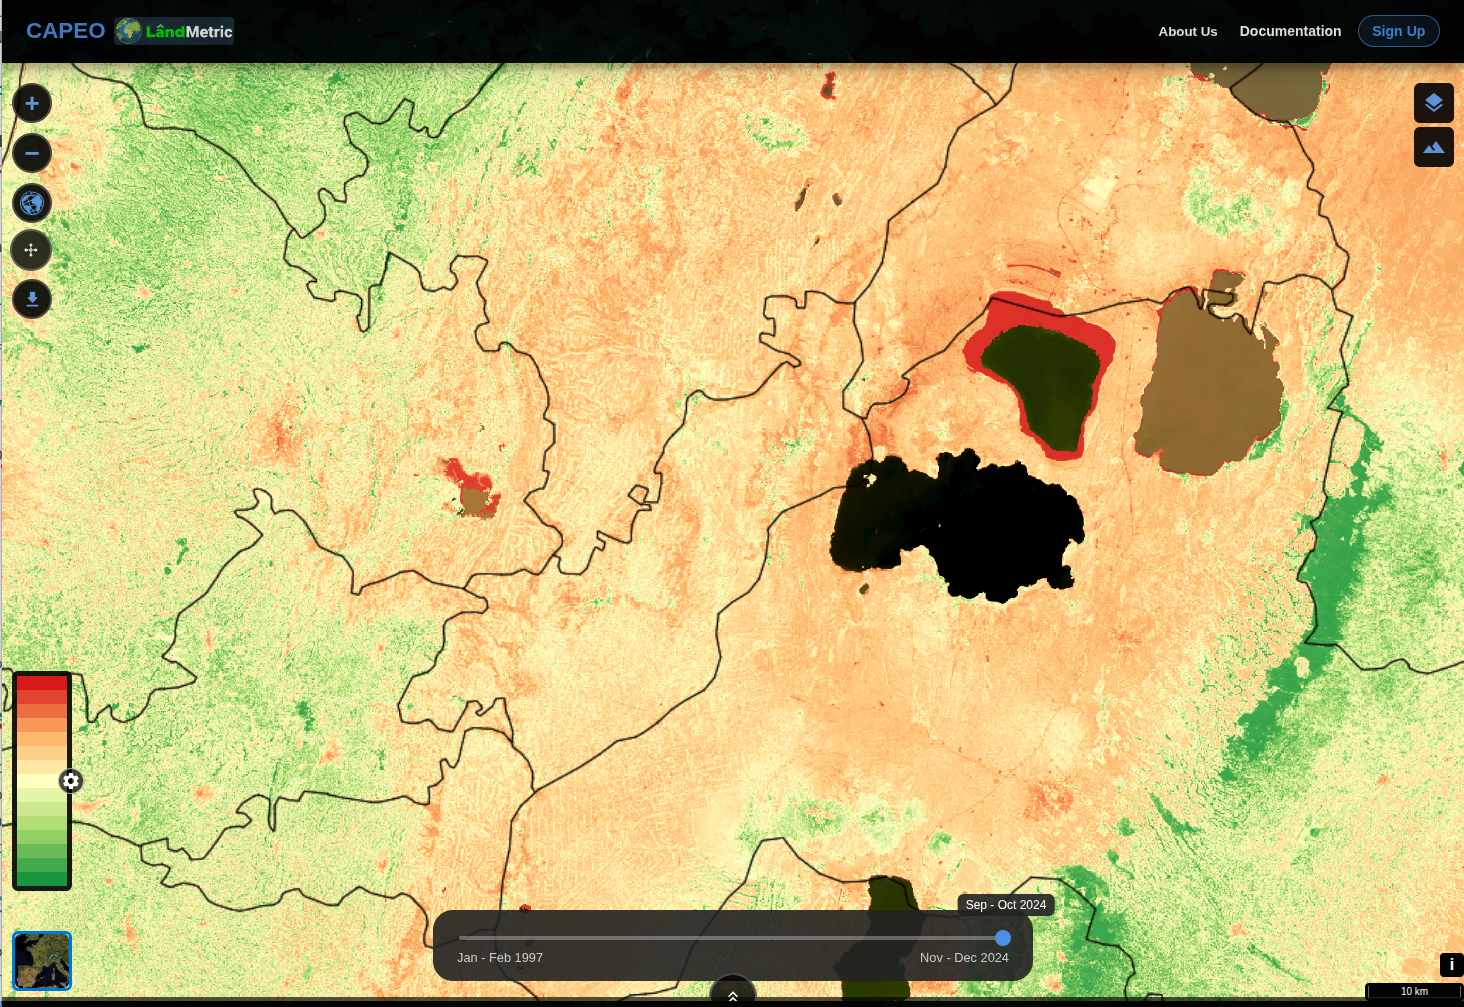
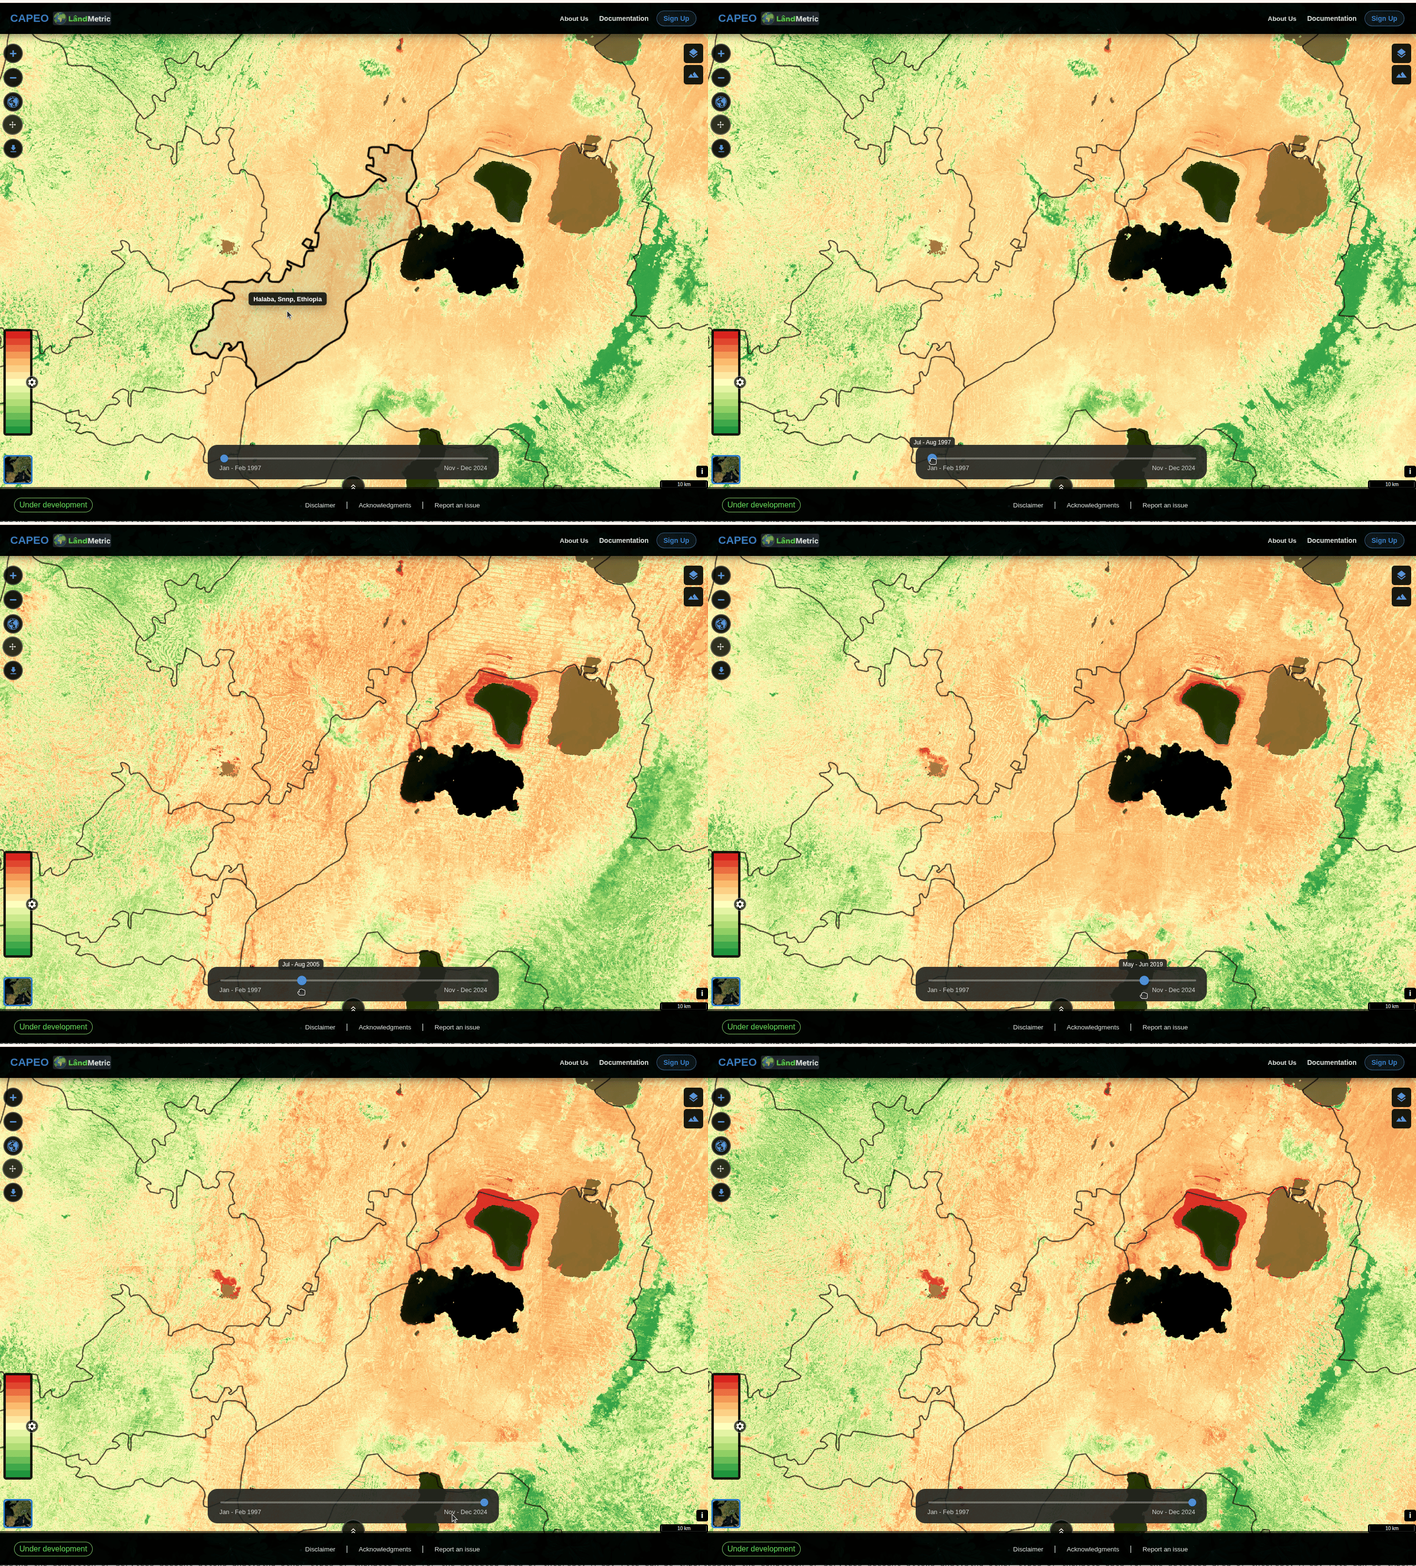
Compare the NDVI maps from 1997 to 2024. Areas shown in greener shades indicate denser vegetation. By examining changes in the color patterns over time, it is possible to identify shifts in vegetation cover and broader land-cover transitions within the study area.
| 1997 | 2014 | 2024 |
|---|---|---|
 |  |  |
The following animation shows the NDVI changes between these period:
3. Analyse the NDVI change in Halaba District
The Landmetric tool allows you to easily retrieve and analyze changes in NDVI between January 1997 and December 2024 at a bi-monthly interval for different administrative areas, including districts, provinces, and countries. In this example, we demonstrate the analysis for Halaba District.
This tile  on the left hand side provides you various statistical and trend analysis functions. Click this tile, then click on the tile
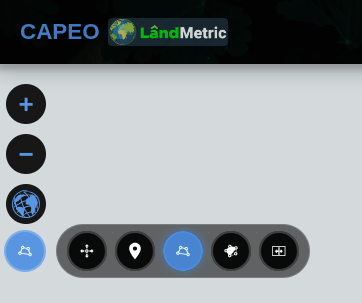
This tool allows you to select any administrative area from the currently displayed administrative boundary map. You can now select Halaba District to generate a graph showing NDVI trend from 1997 to 2024. 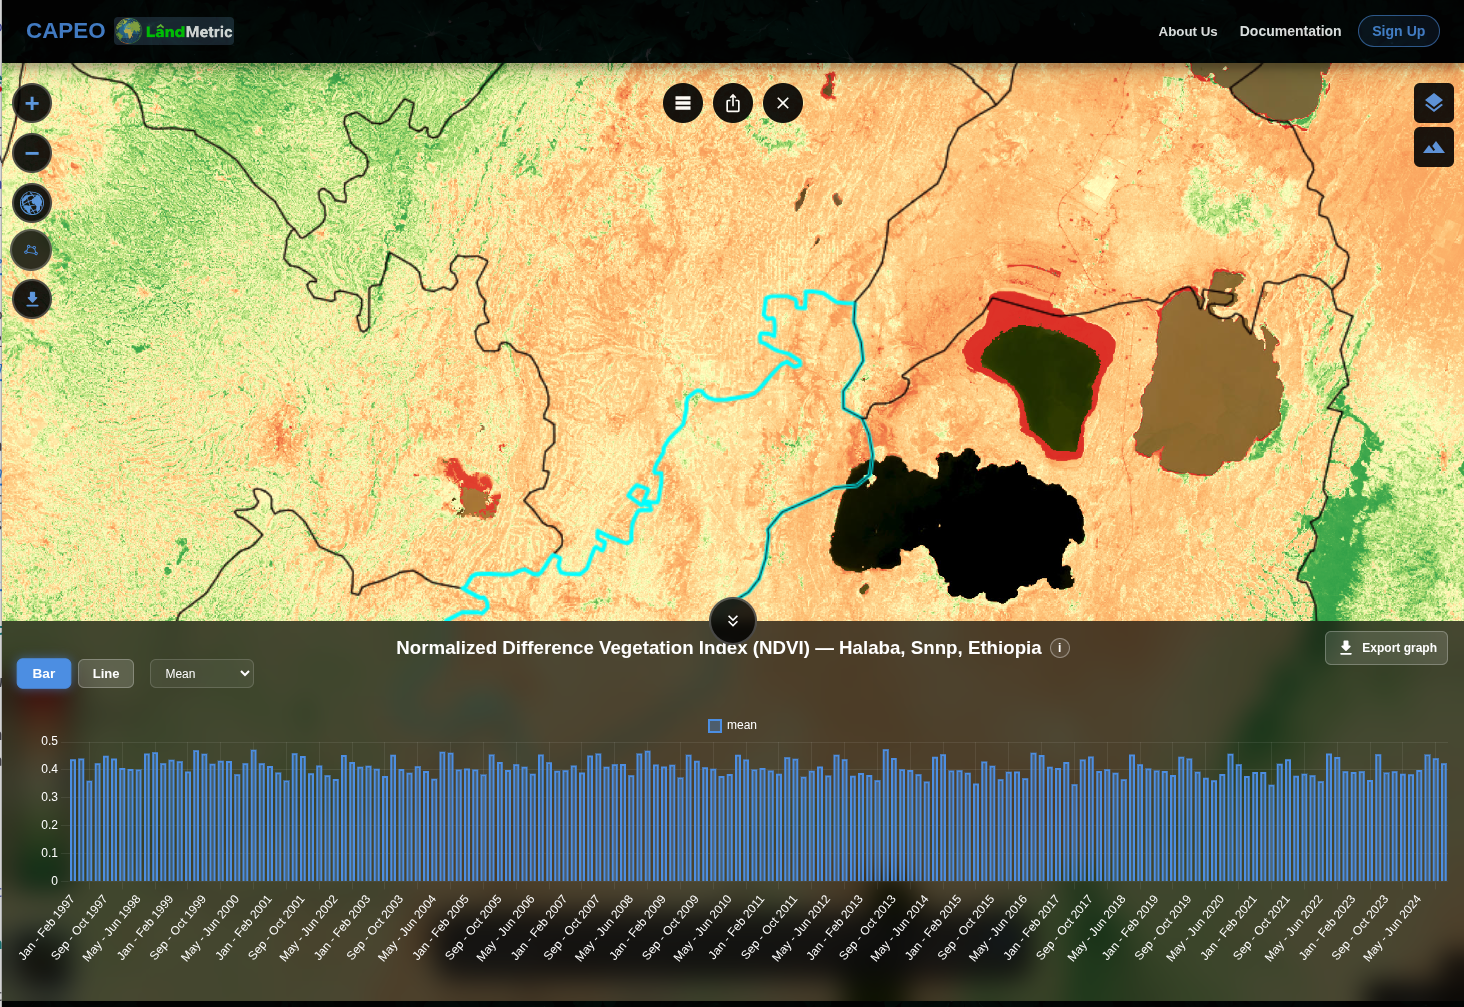
The results can be displayed as a bar chart, showing the average NDVI for Halaba District at each bi-monthly interval, or as a line graph, illustrating the NDVI trend over the entire period from January 1997 to December 2024. In addition to the mean NDVI, both graph types can be used to display other statistical measures for the selected district, including the minimum, maximum, sum, and pixel count.
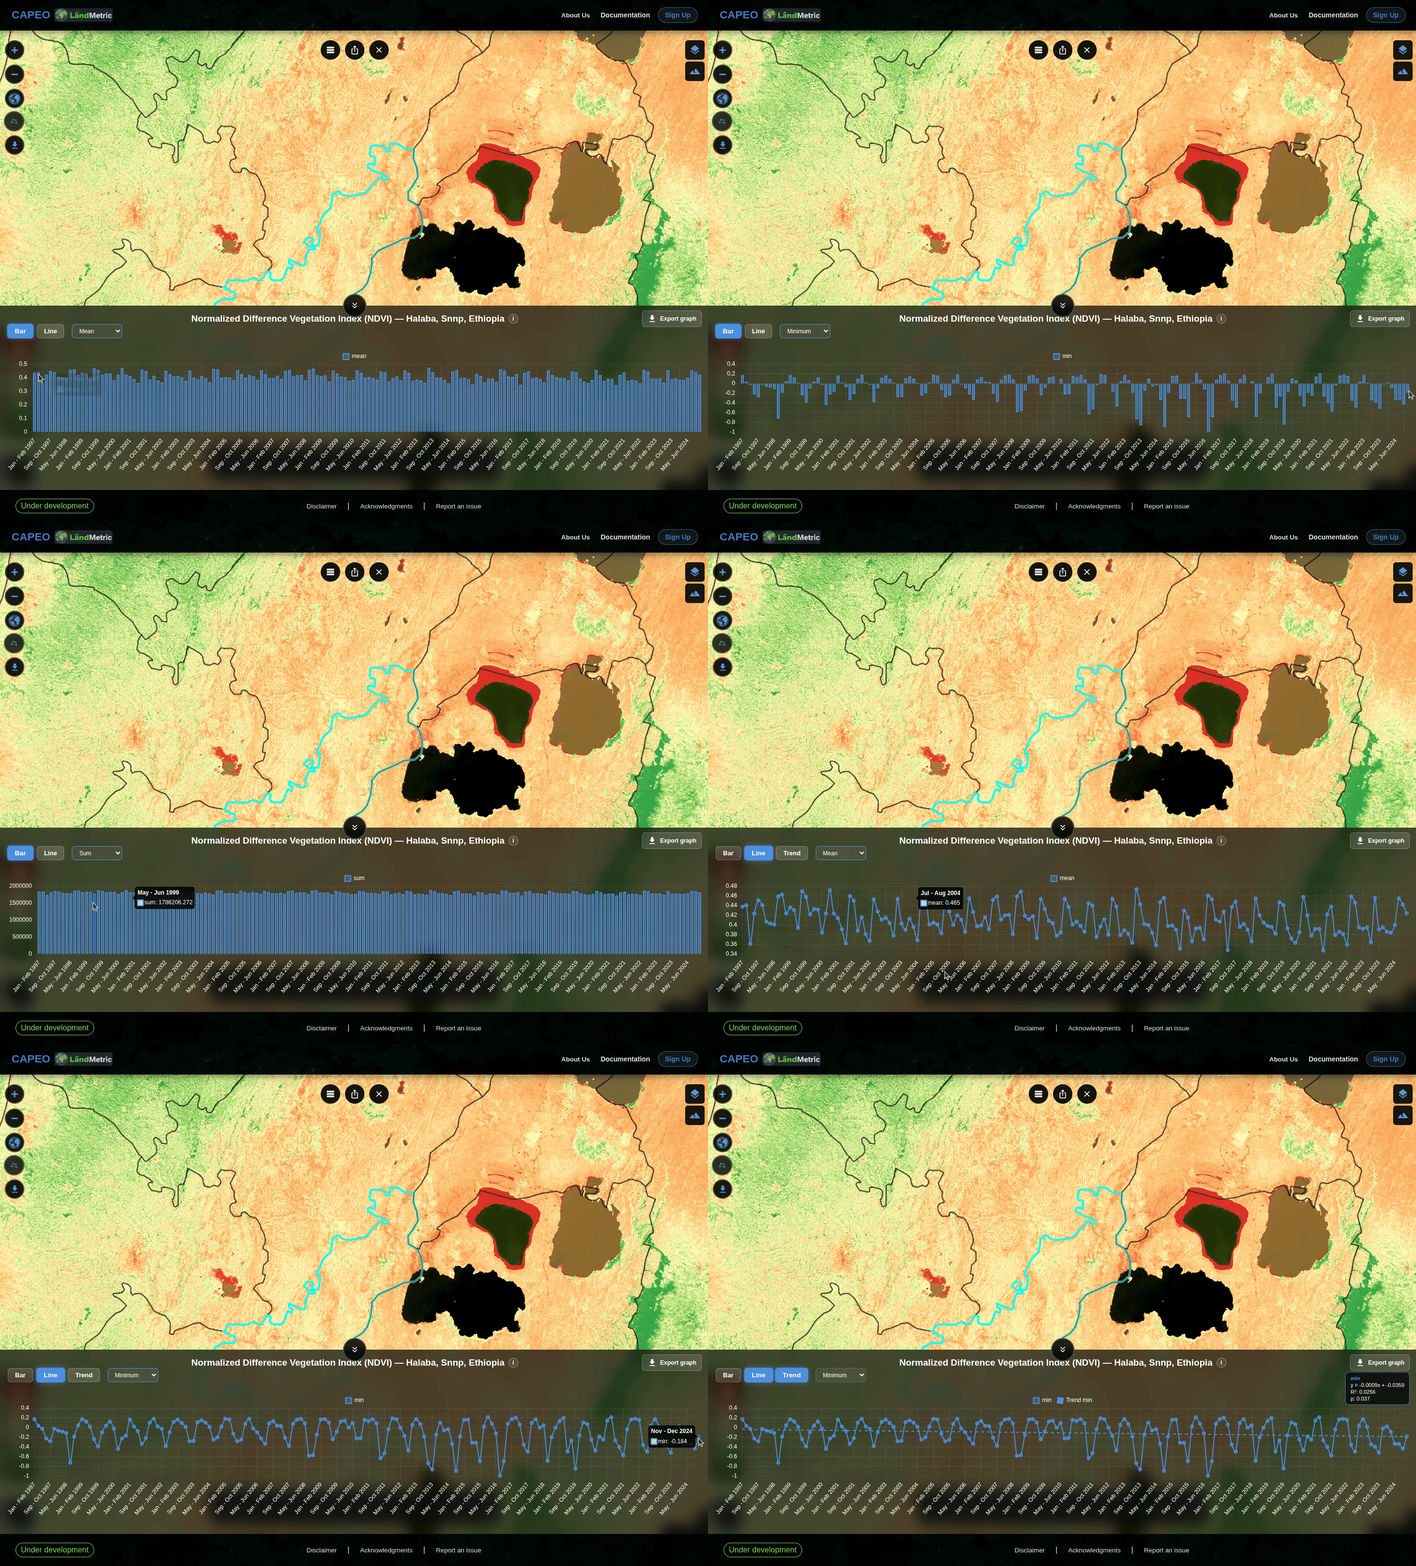
Use the Export Graph option to export the graph as a PNG file, which can then be inserted into a document.
4. Alternatively, you can analyse a Custom-defined Area
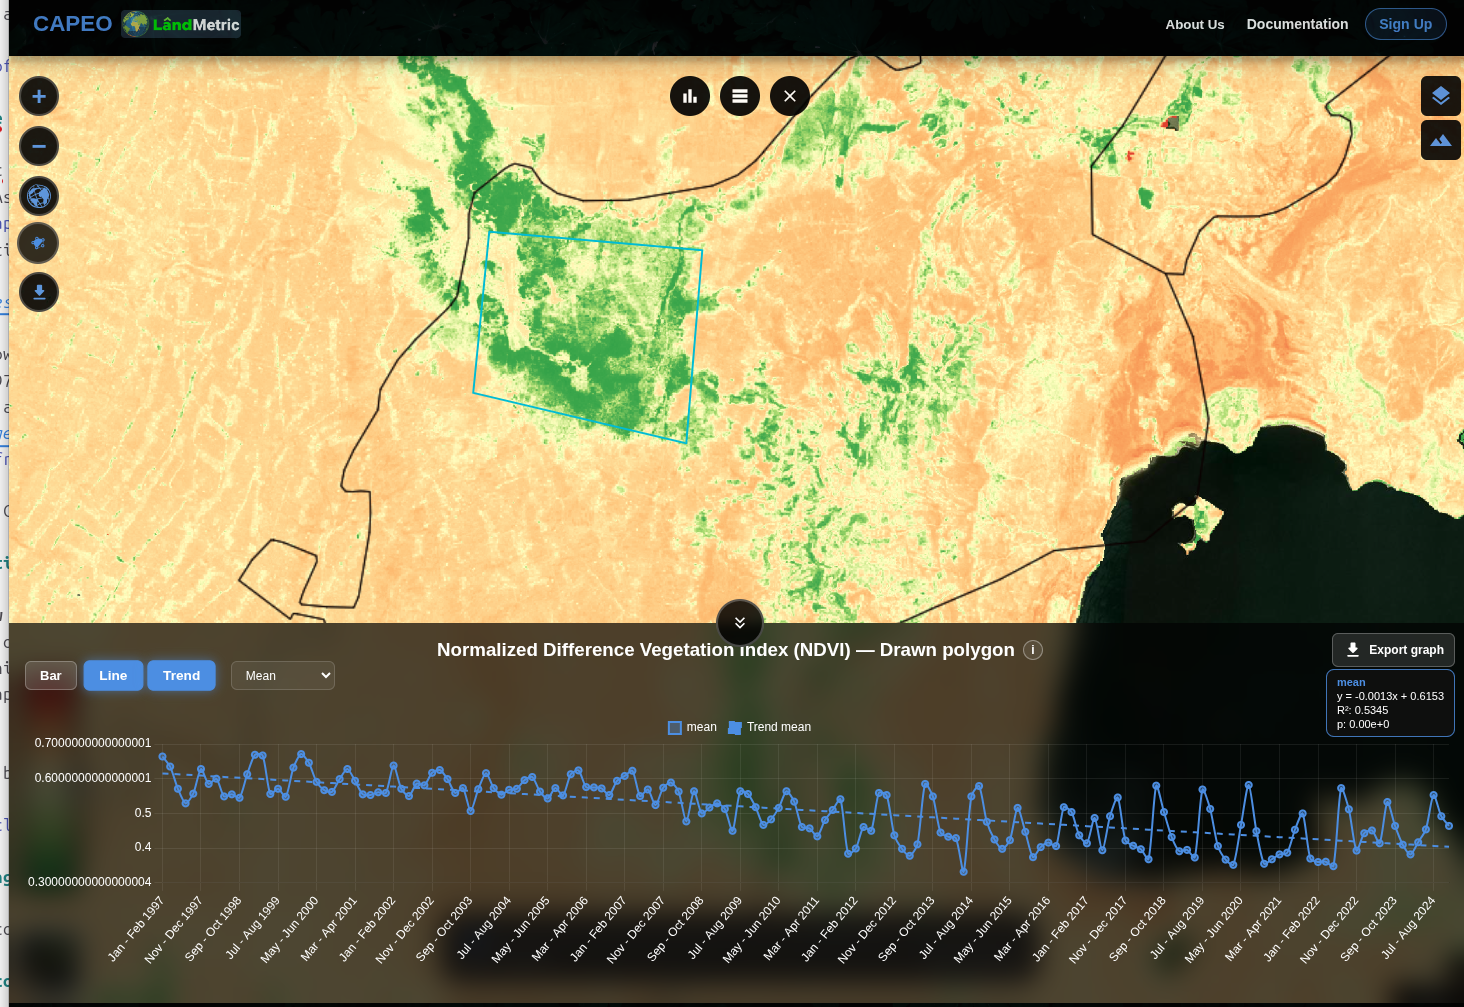
Use the Draw Area tool to create a polygon around your area of interest. The draw area command can be found here:  (second tile from the right). Click on this tile and then use the mouse to define your area of interest.
Once the polygon has been drawn, click the check mark  - first tile from the left - to complete the selection. Follow the same procedure described in the previous section to display the graph. You can also view and download the corresponding accounting tables, which provide the numerical values underlying the graph.
The resulting trend analysis indicates that the mean NDVI of the selected area decreased between 1997 and 2024, suggesting an overall decline in vegetation greenness or density during the study period.
5. Validate the Results with Esri Wayback
Click the Esri Wayback button to open historical satellite imagery for the same location and at the same zoom level. This button can be found on the left hand side, and appears like: 
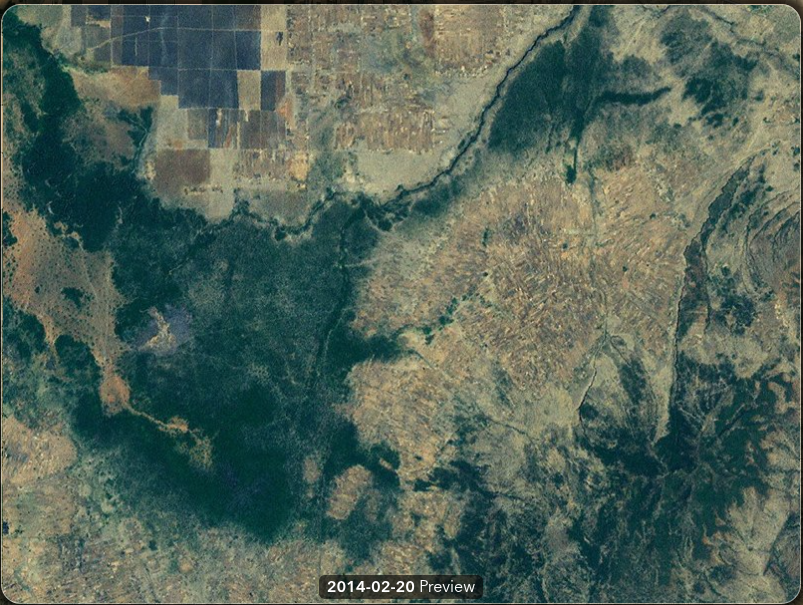
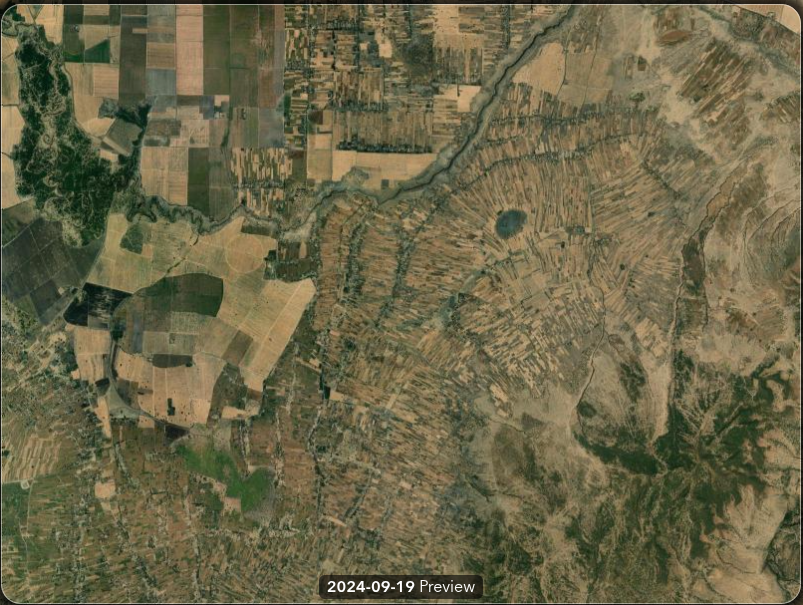
Compare imagery from 2014 and 2024 to independently assess the observed transition from forest or tree cover to agricultural land. The earliest imagery available through Esri Wayback is from 2014; therefore, it cannot be used to examine conditions in 1997.
| 2014 imagery | 2024 imagery |
|---|---|
 |  |