Point Query & Select Area & Draw Area & Area comparison & ESRI Wayback
Tools menu
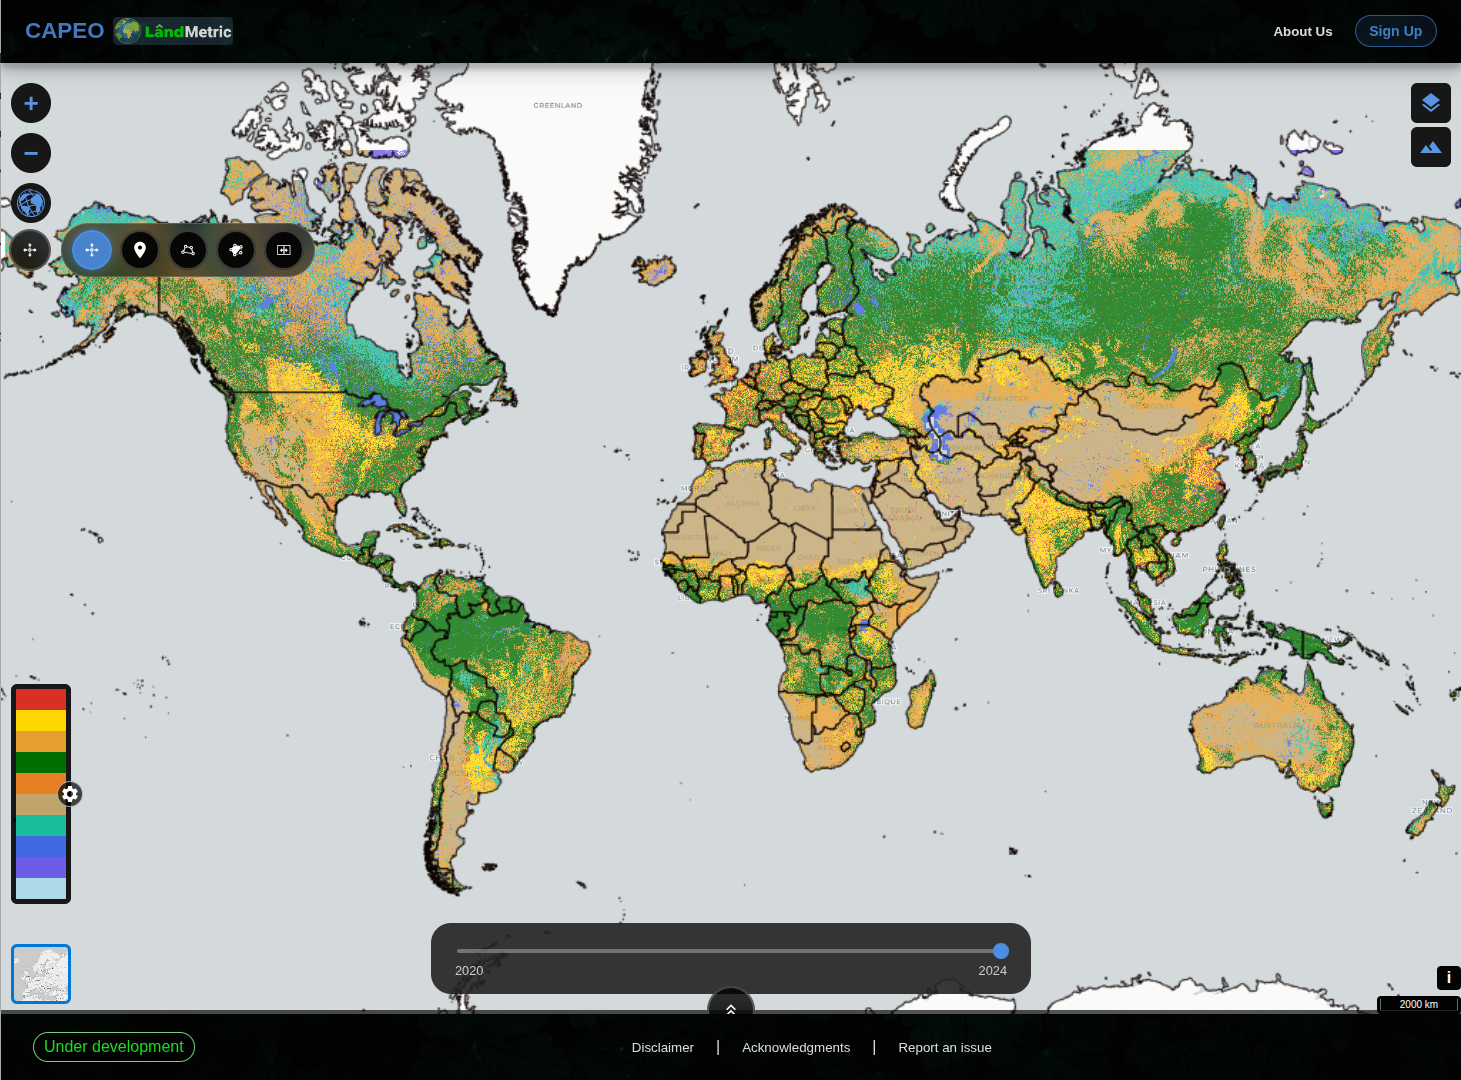
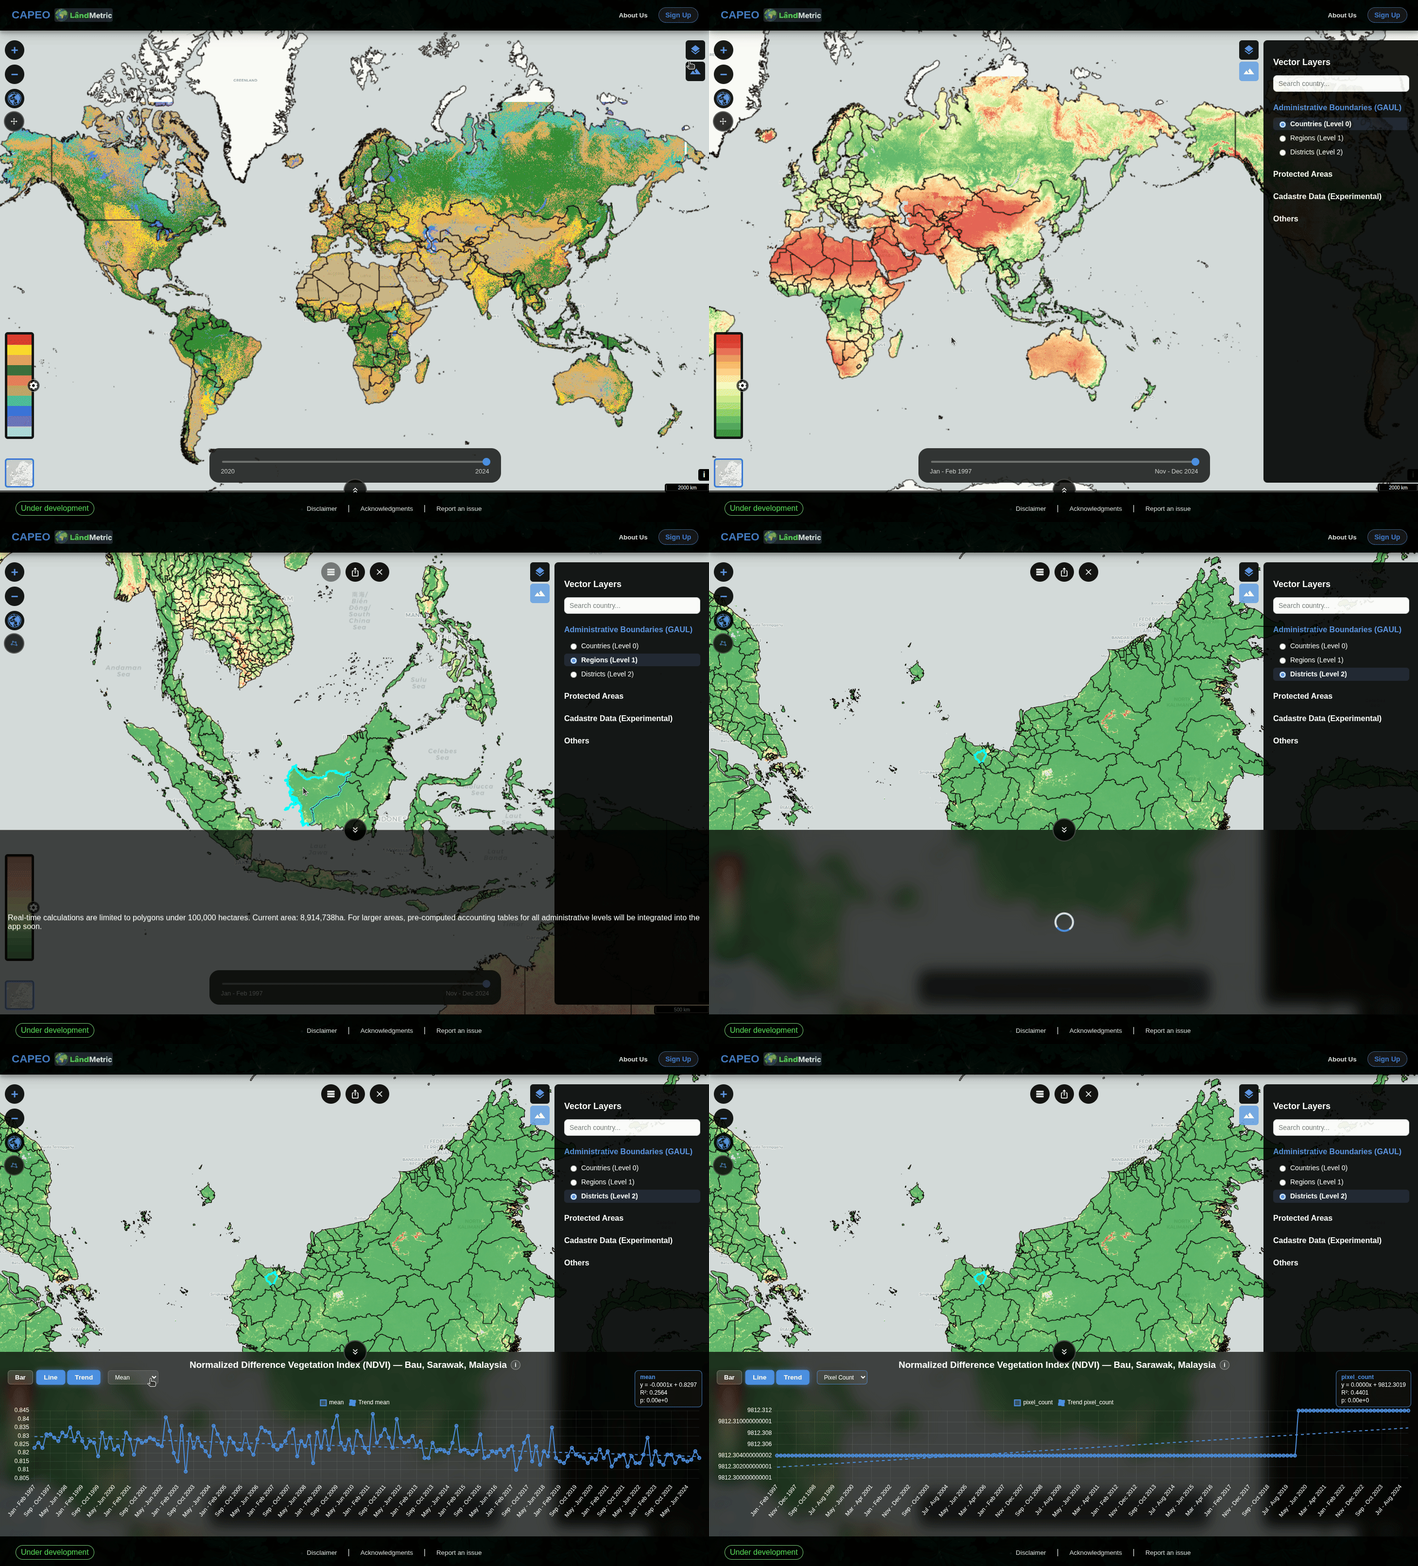
Map tools are grouped under a single Map tools icon on the left side of the map. Clicking it expands a row of five tools: Default Drag, Point Query, Select Area, Draw Area, and Area Comparison.
Directly above the Map tools icon is the button for opening ESRI Wayback.
Throughout this documentation, we use Land Cover 30m and NDVI as running examples, applied to an administrative unit in Indonesia, so you can see how the same dataset supports multiple types of analysis across the Tools section.
Point Query
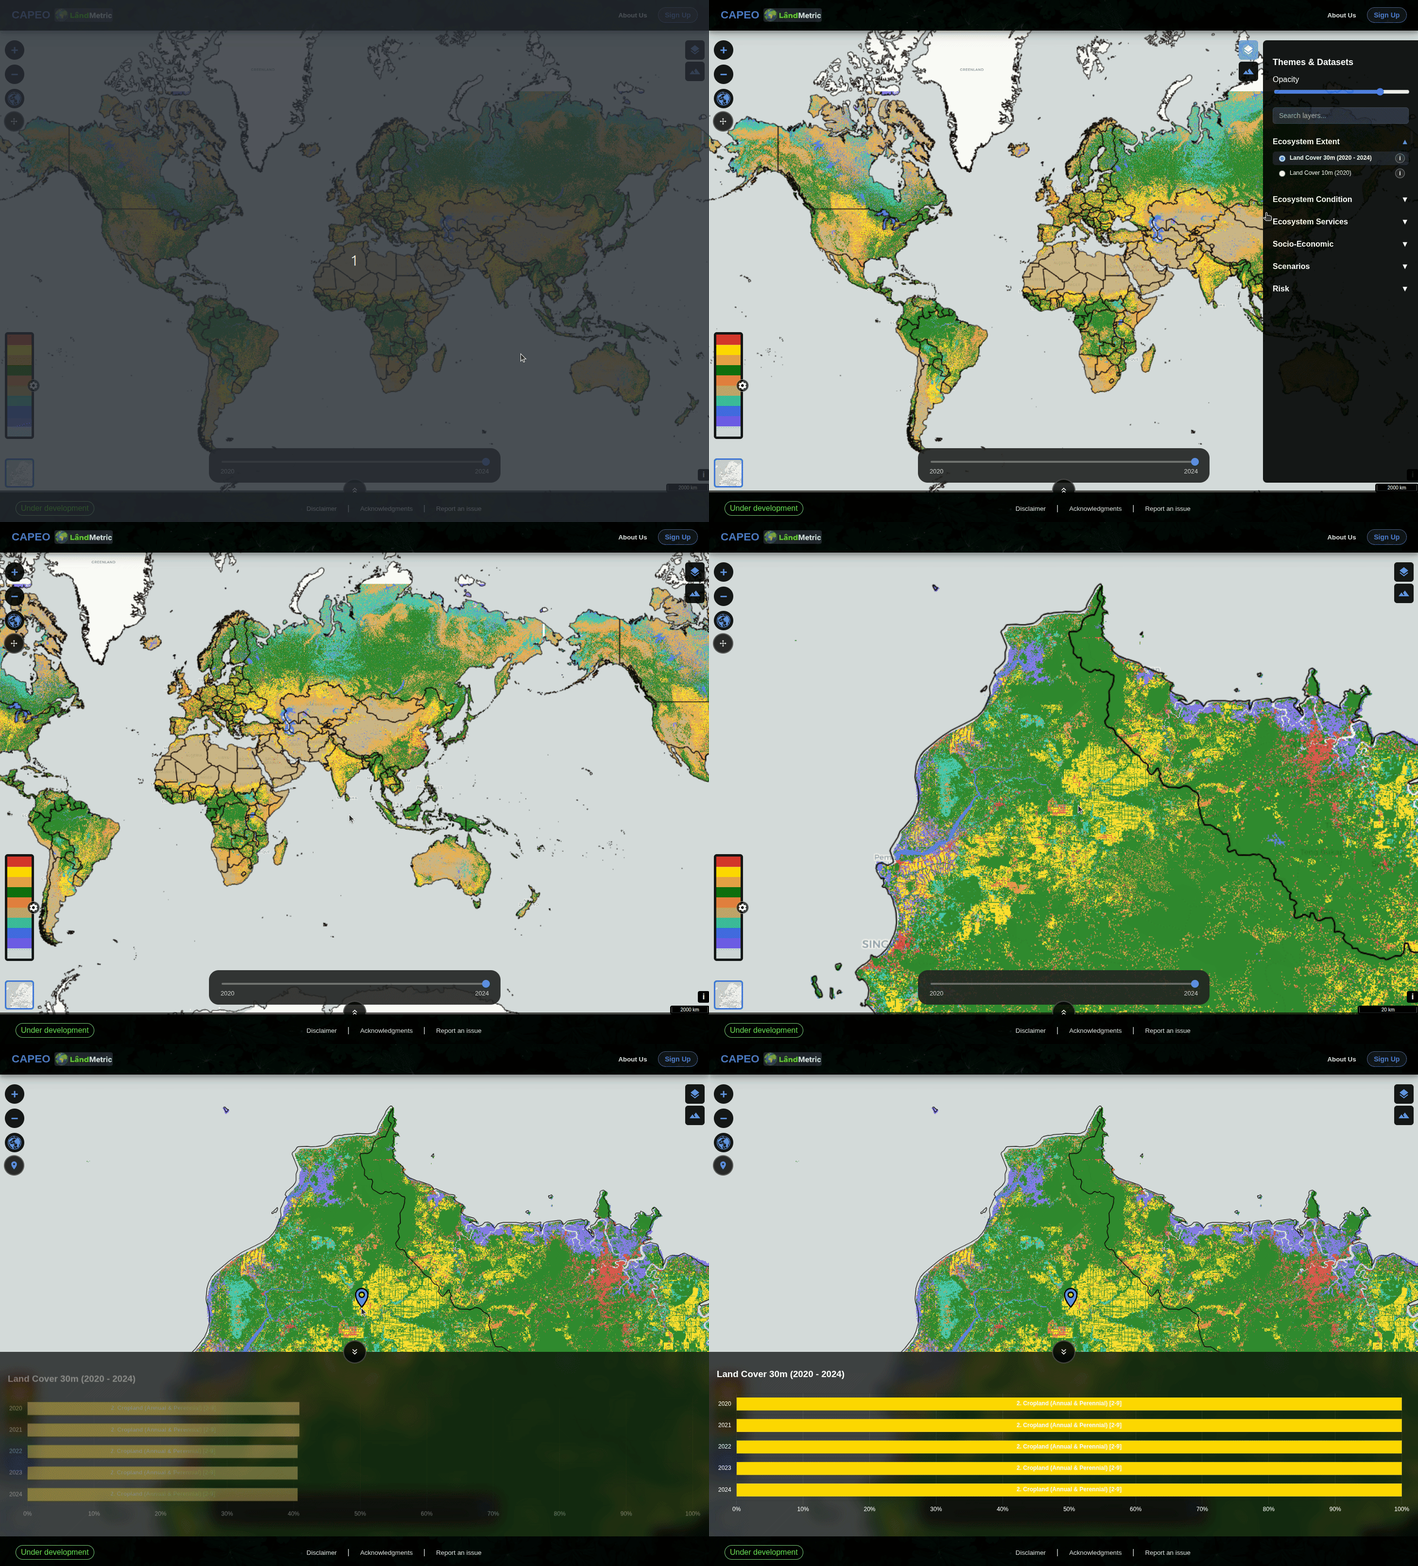
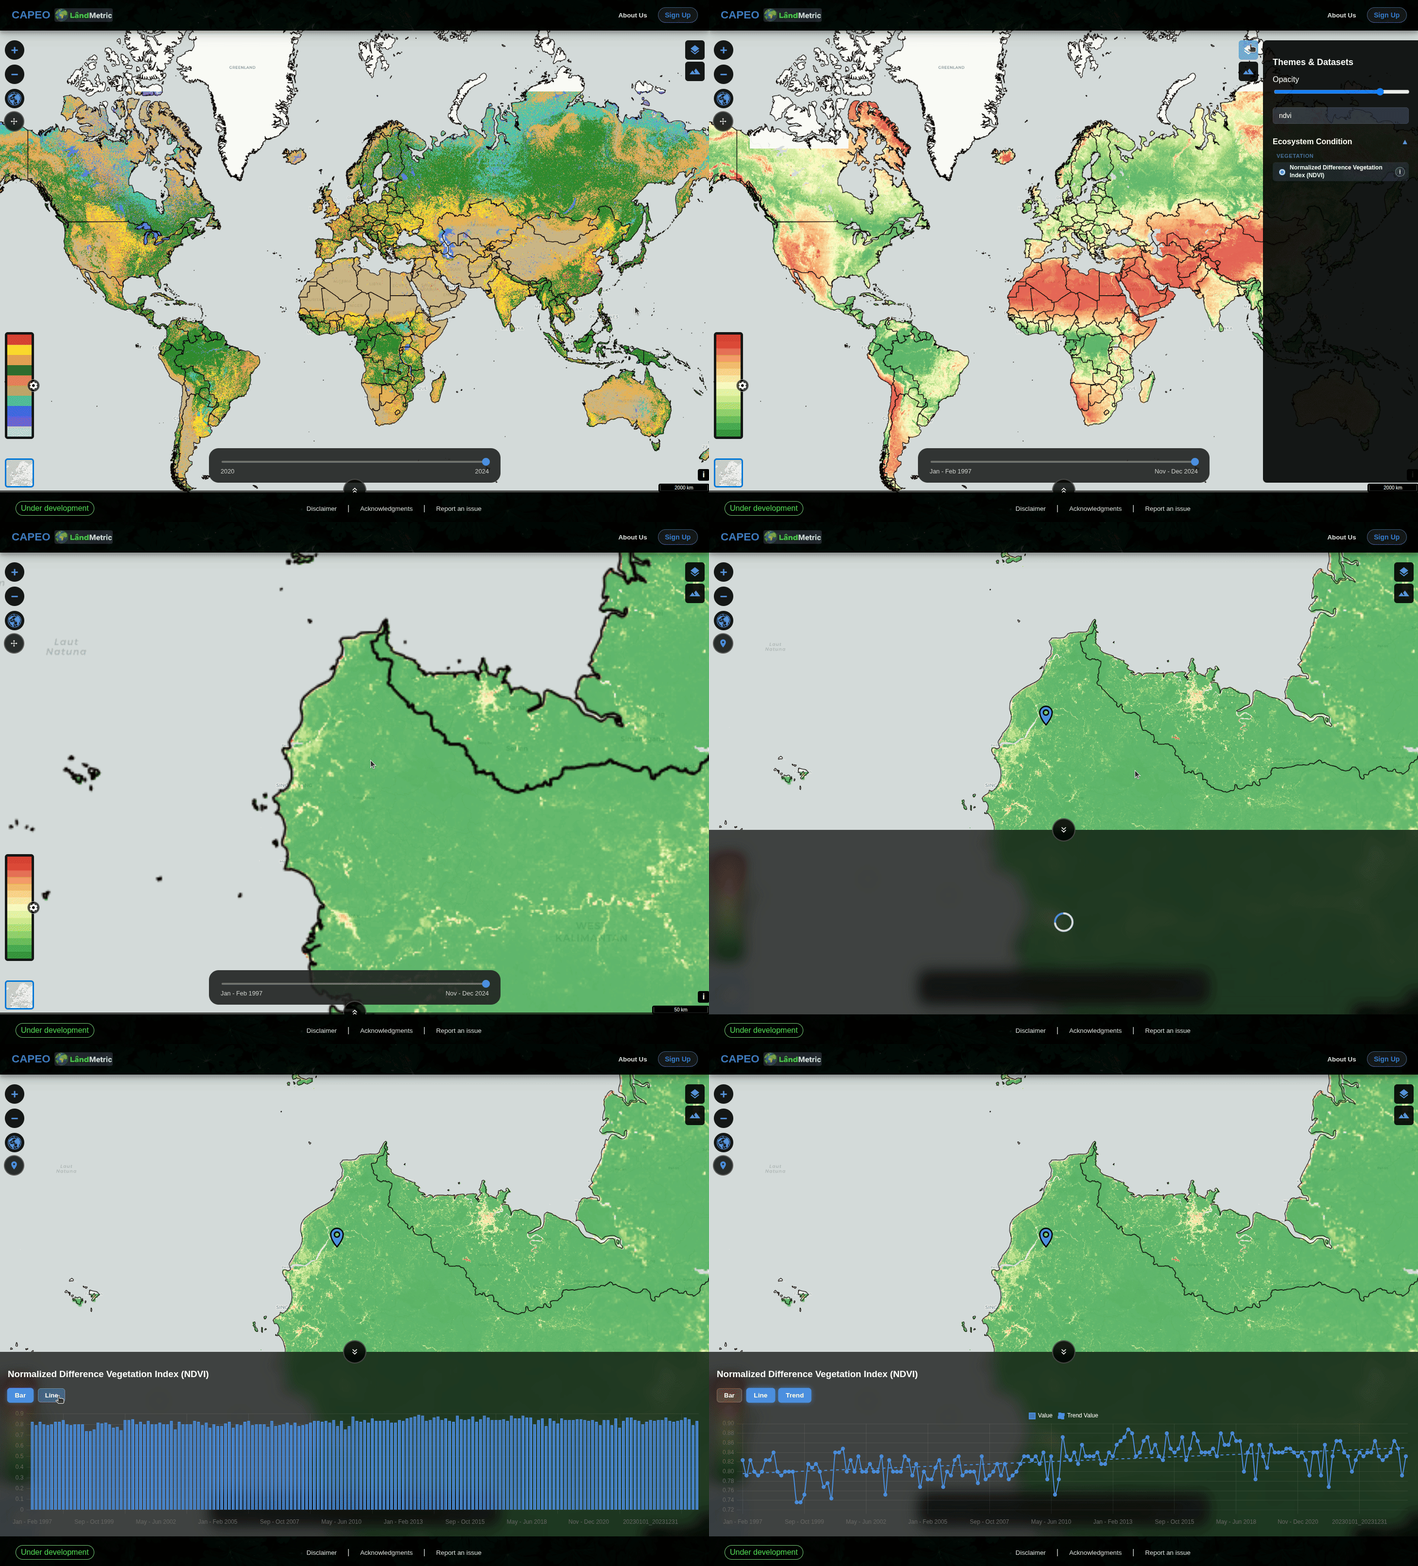
Click any location on the selected map to open a panel at the bottom of the screen. The panel displays the active layer’s values at that location across the available time series.
For example:
- On the Land Cover 30 m map, selecting a palm point in Indonesia returned the class Cropland (Annual & Perennial) for each year from 2020 to 2024.
- On the NDVI map, selecting a point in Indonesia displayed the available time-series data as a bar chart, a line chart, and a trend analysis.
Select Area
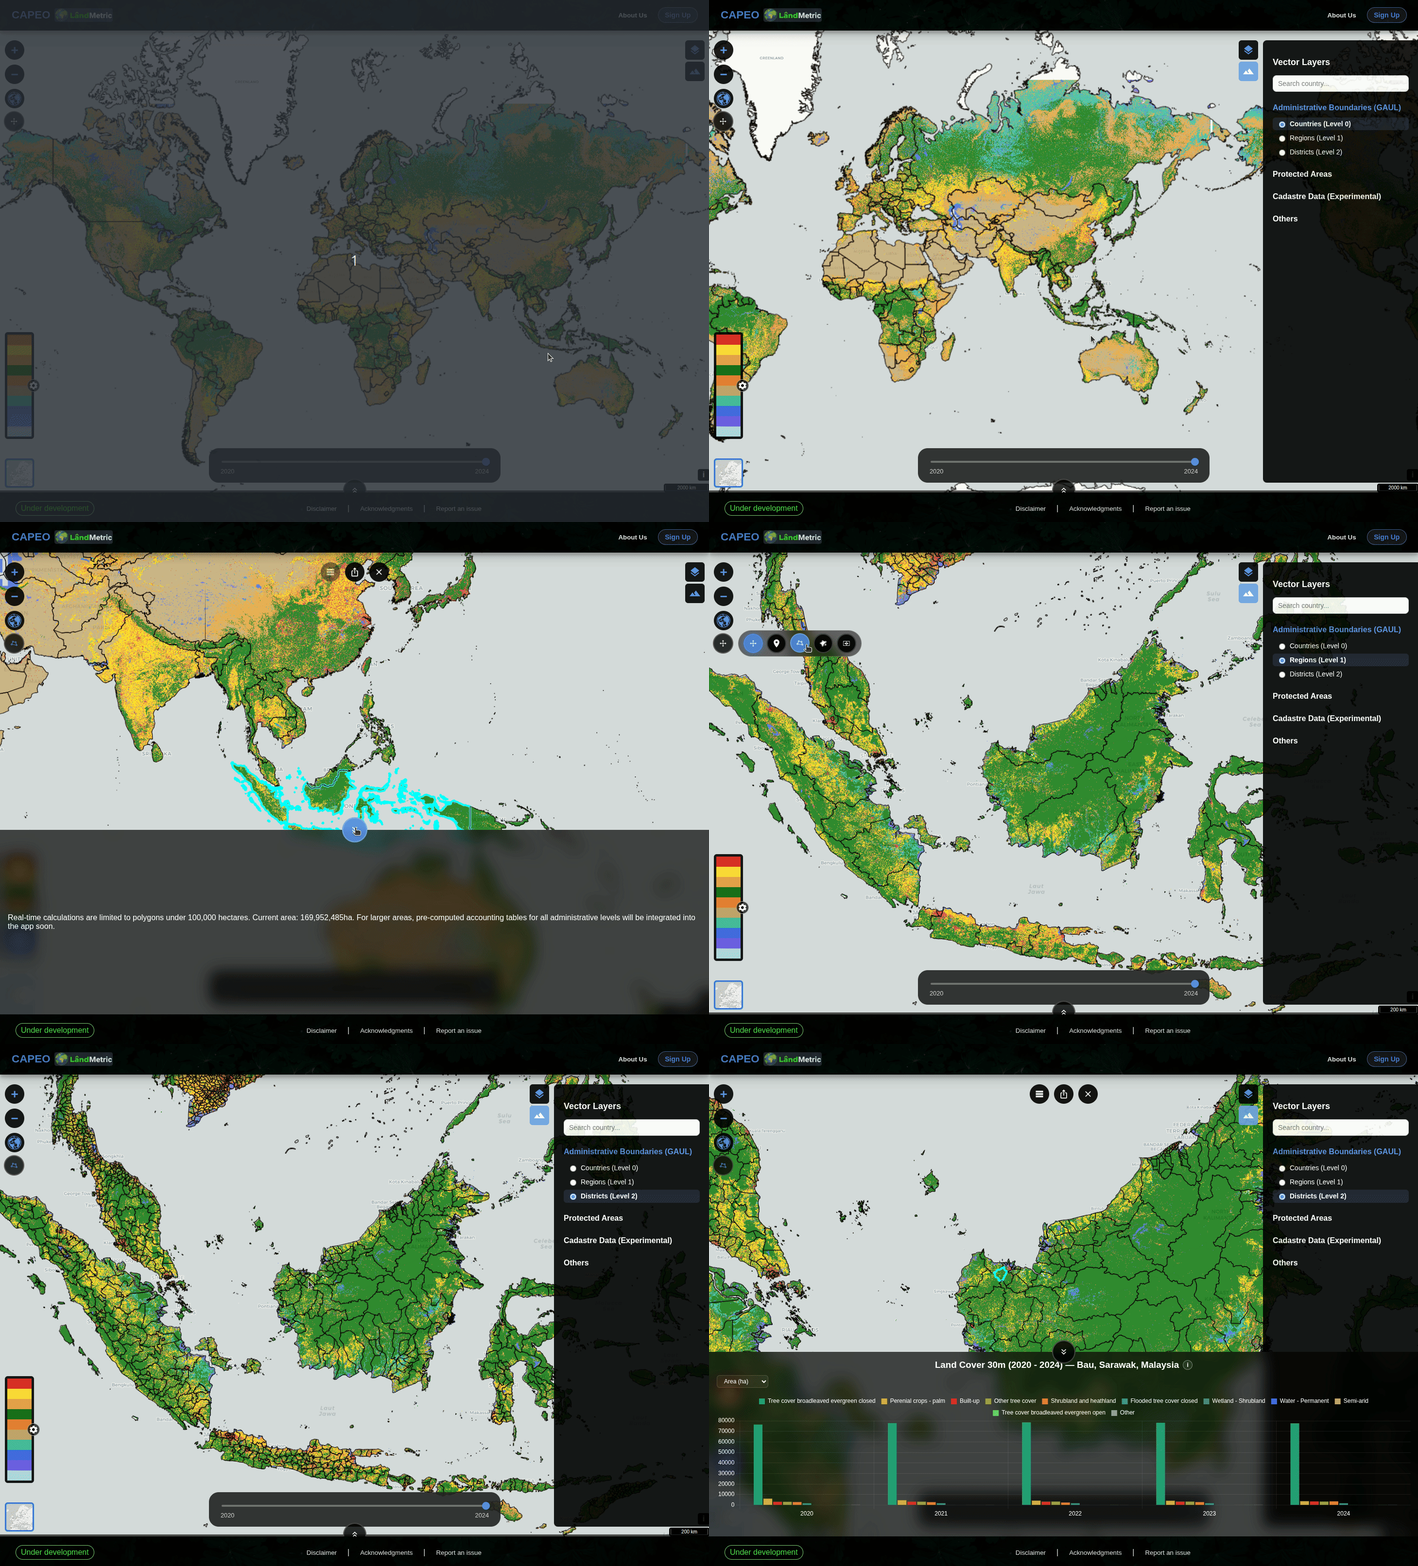
Click an existing administrative boundary, such as a country, province, or district, to select it. The selected area is highlighted in cyan.
For areas smaller than 100,000 ha, the platform calculates area statistics in real time. For larger areas, a message indicates that pre-computed statistics will be available in a future release.
For example:
- On the Land Cover 30 m map, selecting administrative areas at the country, province, or district level in Indonesia displays the area covered by each land-cover class for every available year from 2020 to 2024.
- On the NDVI map, selecting an area in Indonesia displays the available time-series data as a bar chart, a line chart, and a trend analysis for the selected area.
Draw Area
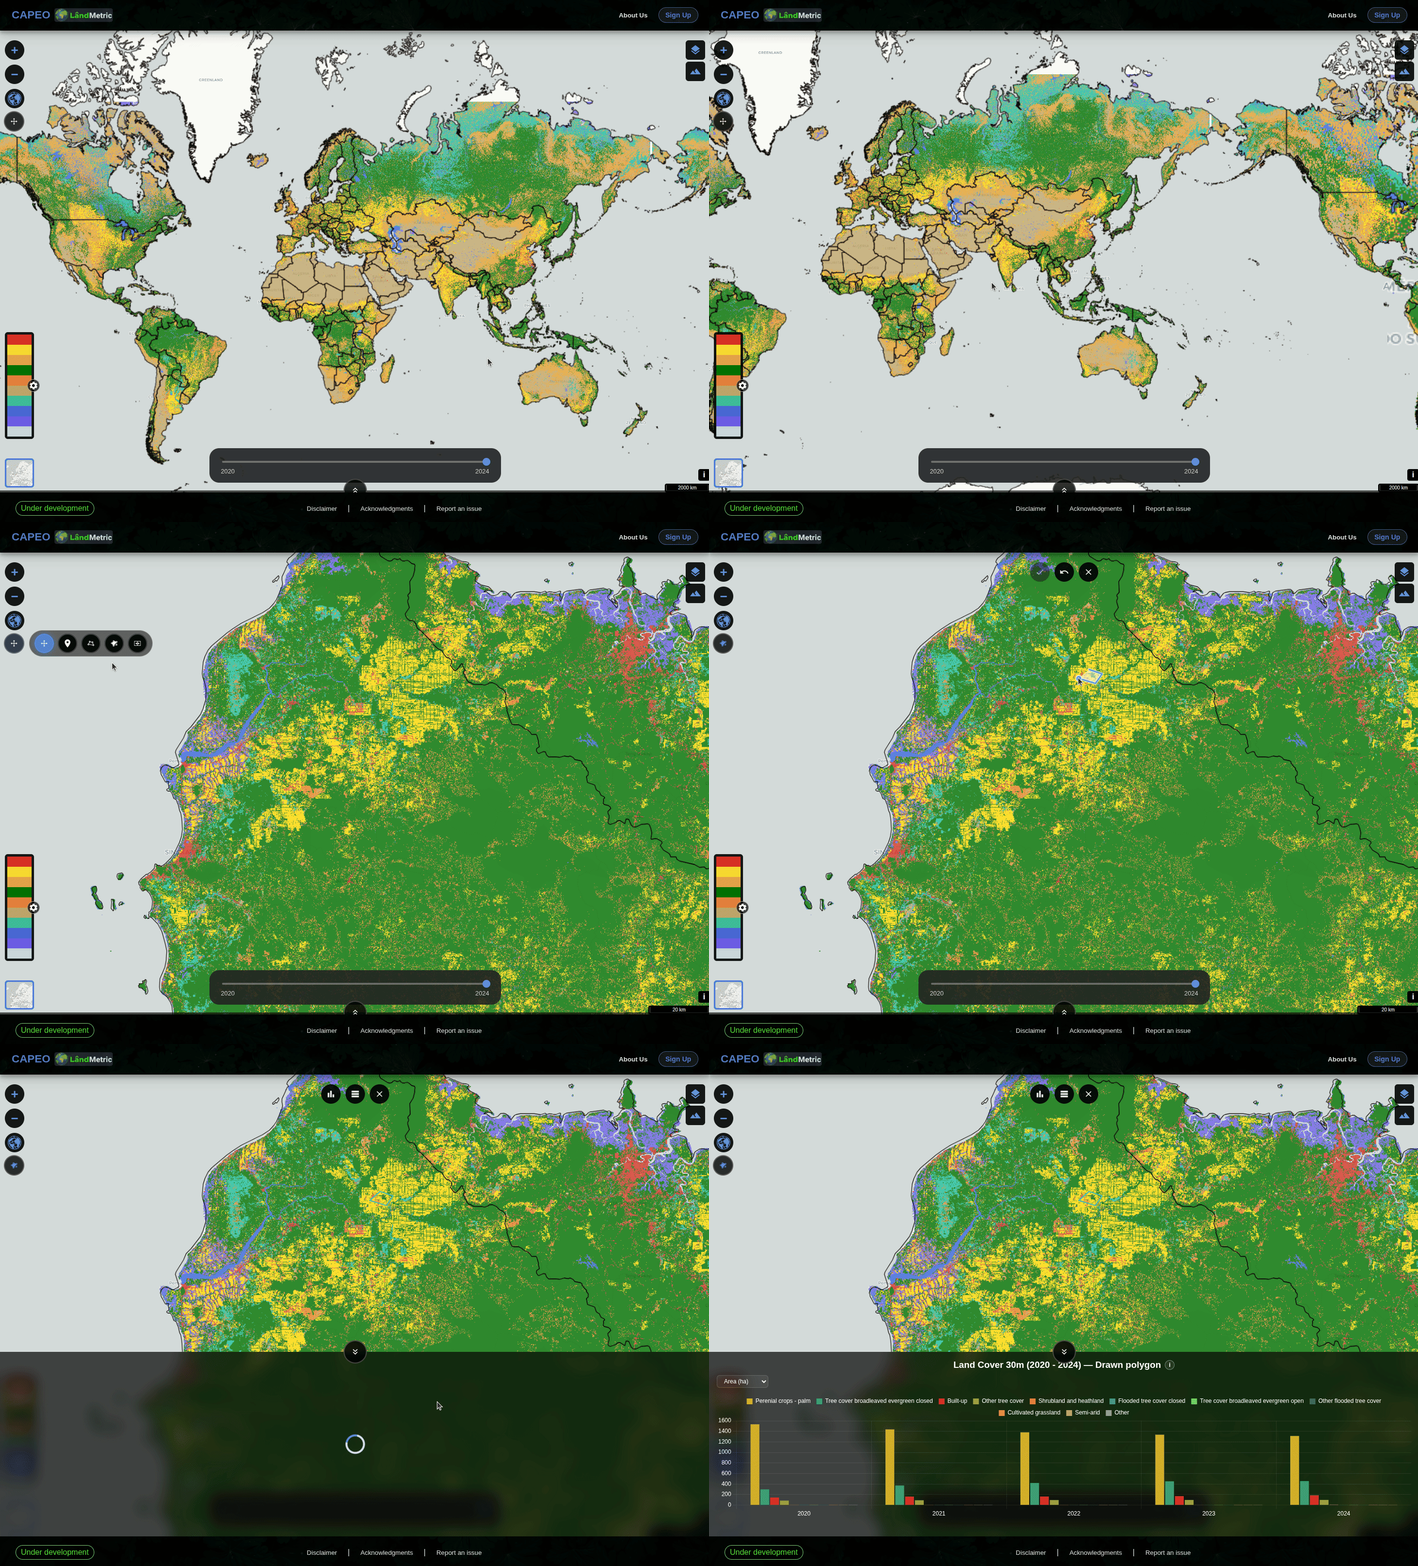
Use the Draw Area tool to create a custom polygon by placing vertices on the map. While drawing, you can:
- Select Confirm (✓) to complete the polygon.
- Select Undo (↩) to remove the most recently placed vertex.
- Select Cancel (✕) to discard the polygon.
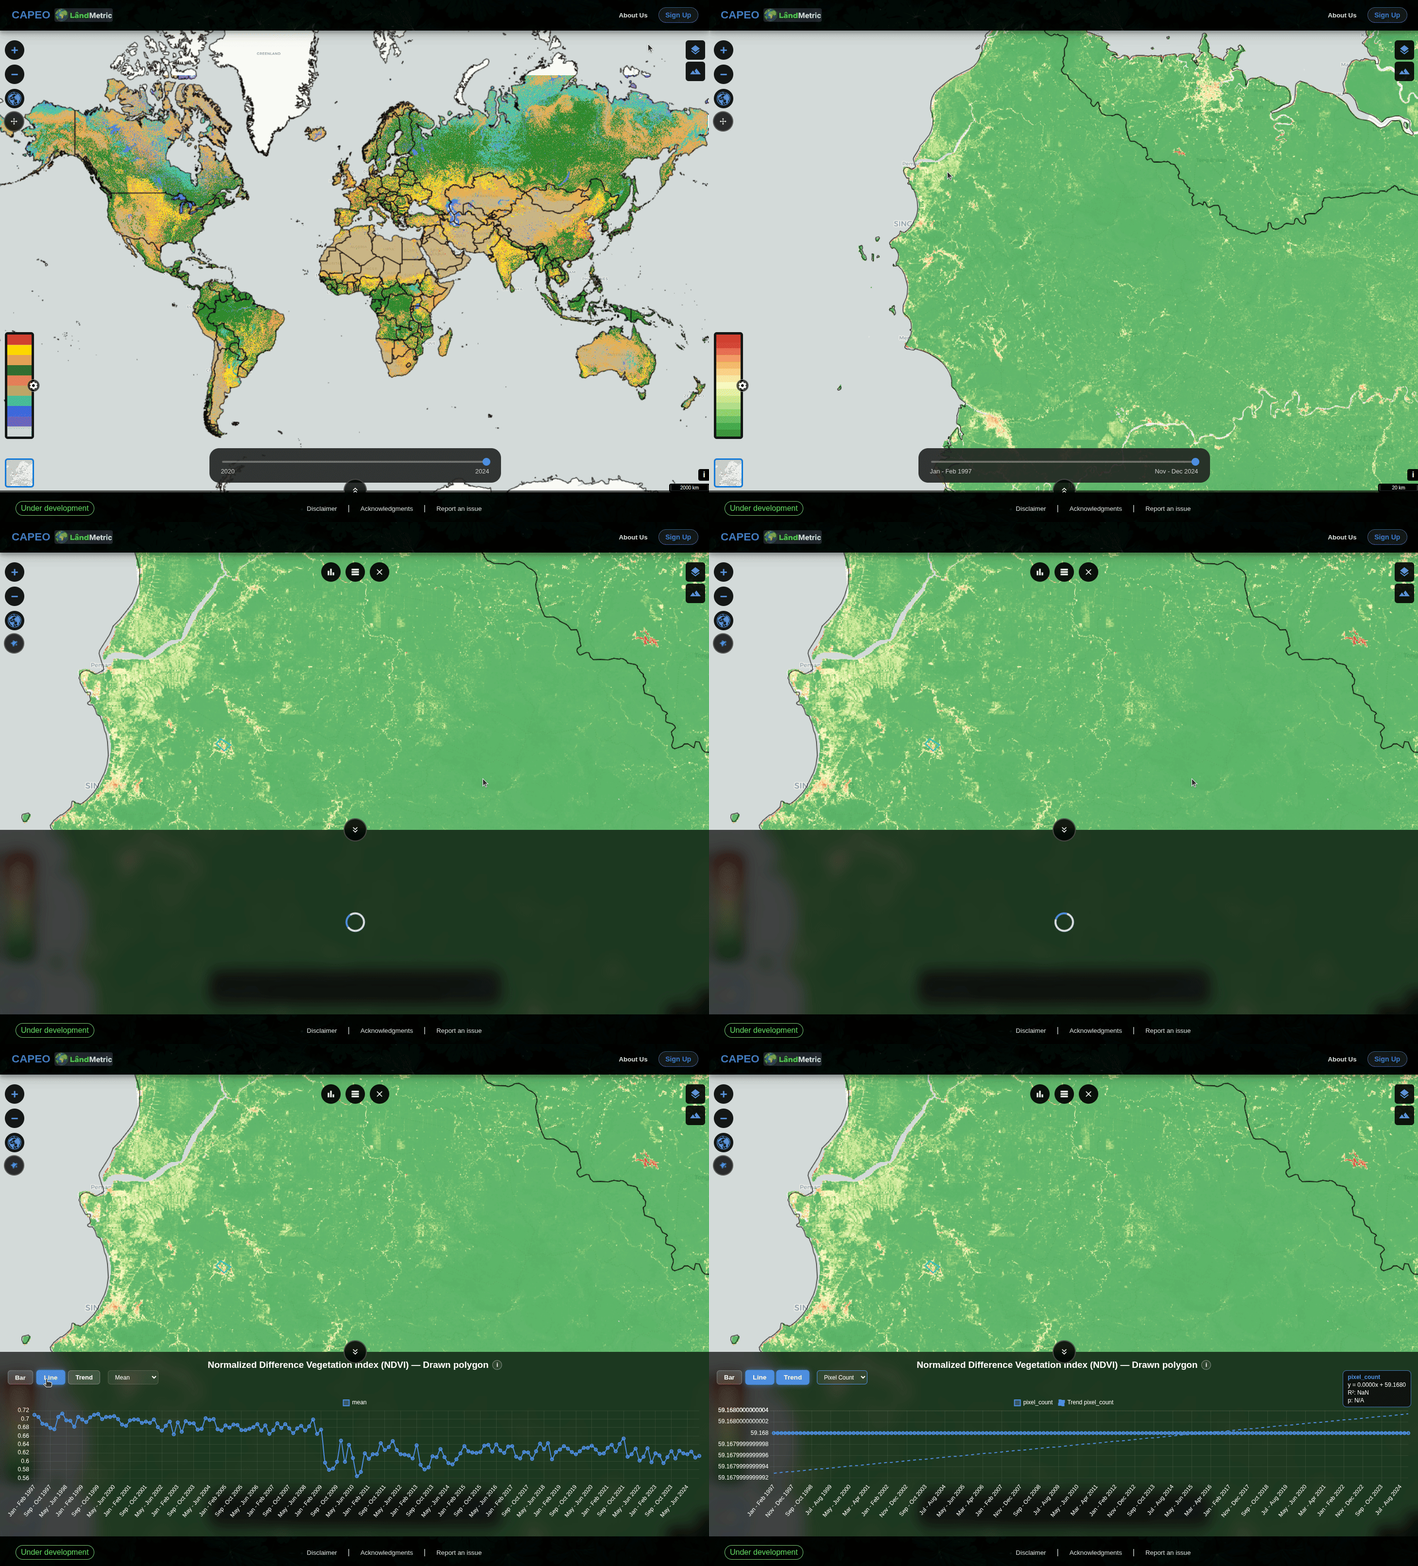
After the polygon is completed, the platform calculates the same statistics provided by the Select Area tool, but for the custom-drawn area.
For example:
- On the Land Cover 30 m map, drawing a polygon in Indonesia displays the area covered by each land-cover class within the polygon for every available year from 2020 to 2024.
- On the NDVI map, drawing a polygon in Indonesia displays the available time-series data as a bar chart, a line chart, and a trend analysis for the drawn area.
Area Comparison
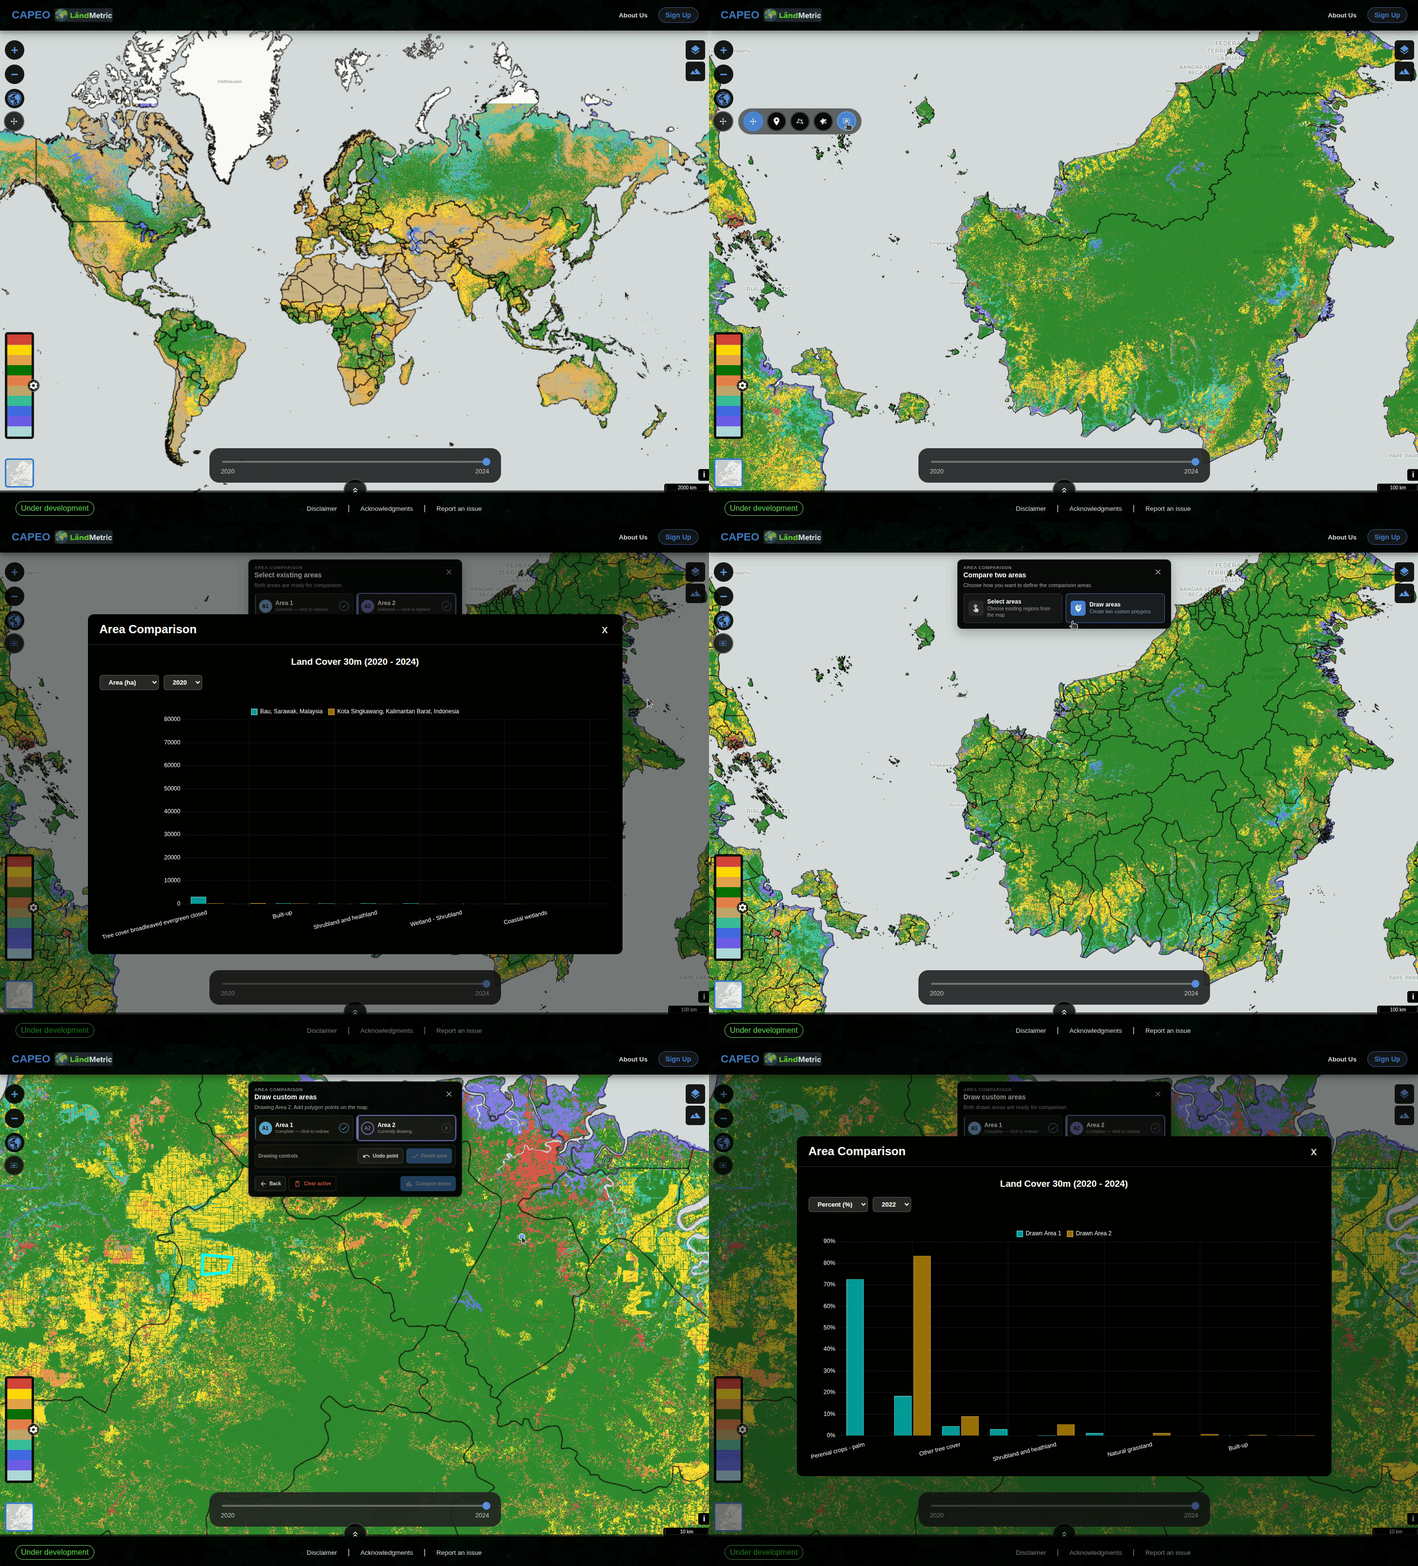
Use the Area Comparison tool to compare two areas side by side. When the tool opens, choose one of the following methods:
- Select areas — select two existing administrative areas.
- Draw areas — draw two custom polygons on the map.
After defining both areas, click Compare areas to display comparative charts and tables for the active map layer.
For example:
- On the Land Cover 30 m map, select two administrative areas smaller than 100,000 ha, or draw two custom areas of interest. The areas are highlighted as Area 1 and Area 2, and the results compare the area covered by each land-cover class across all available years.
- On the NDVI map, select two administrative areas or draw two custom polygons. The results compare the time series for both areas using bar charts, line charts, and trend analyses.
Esri Wayback
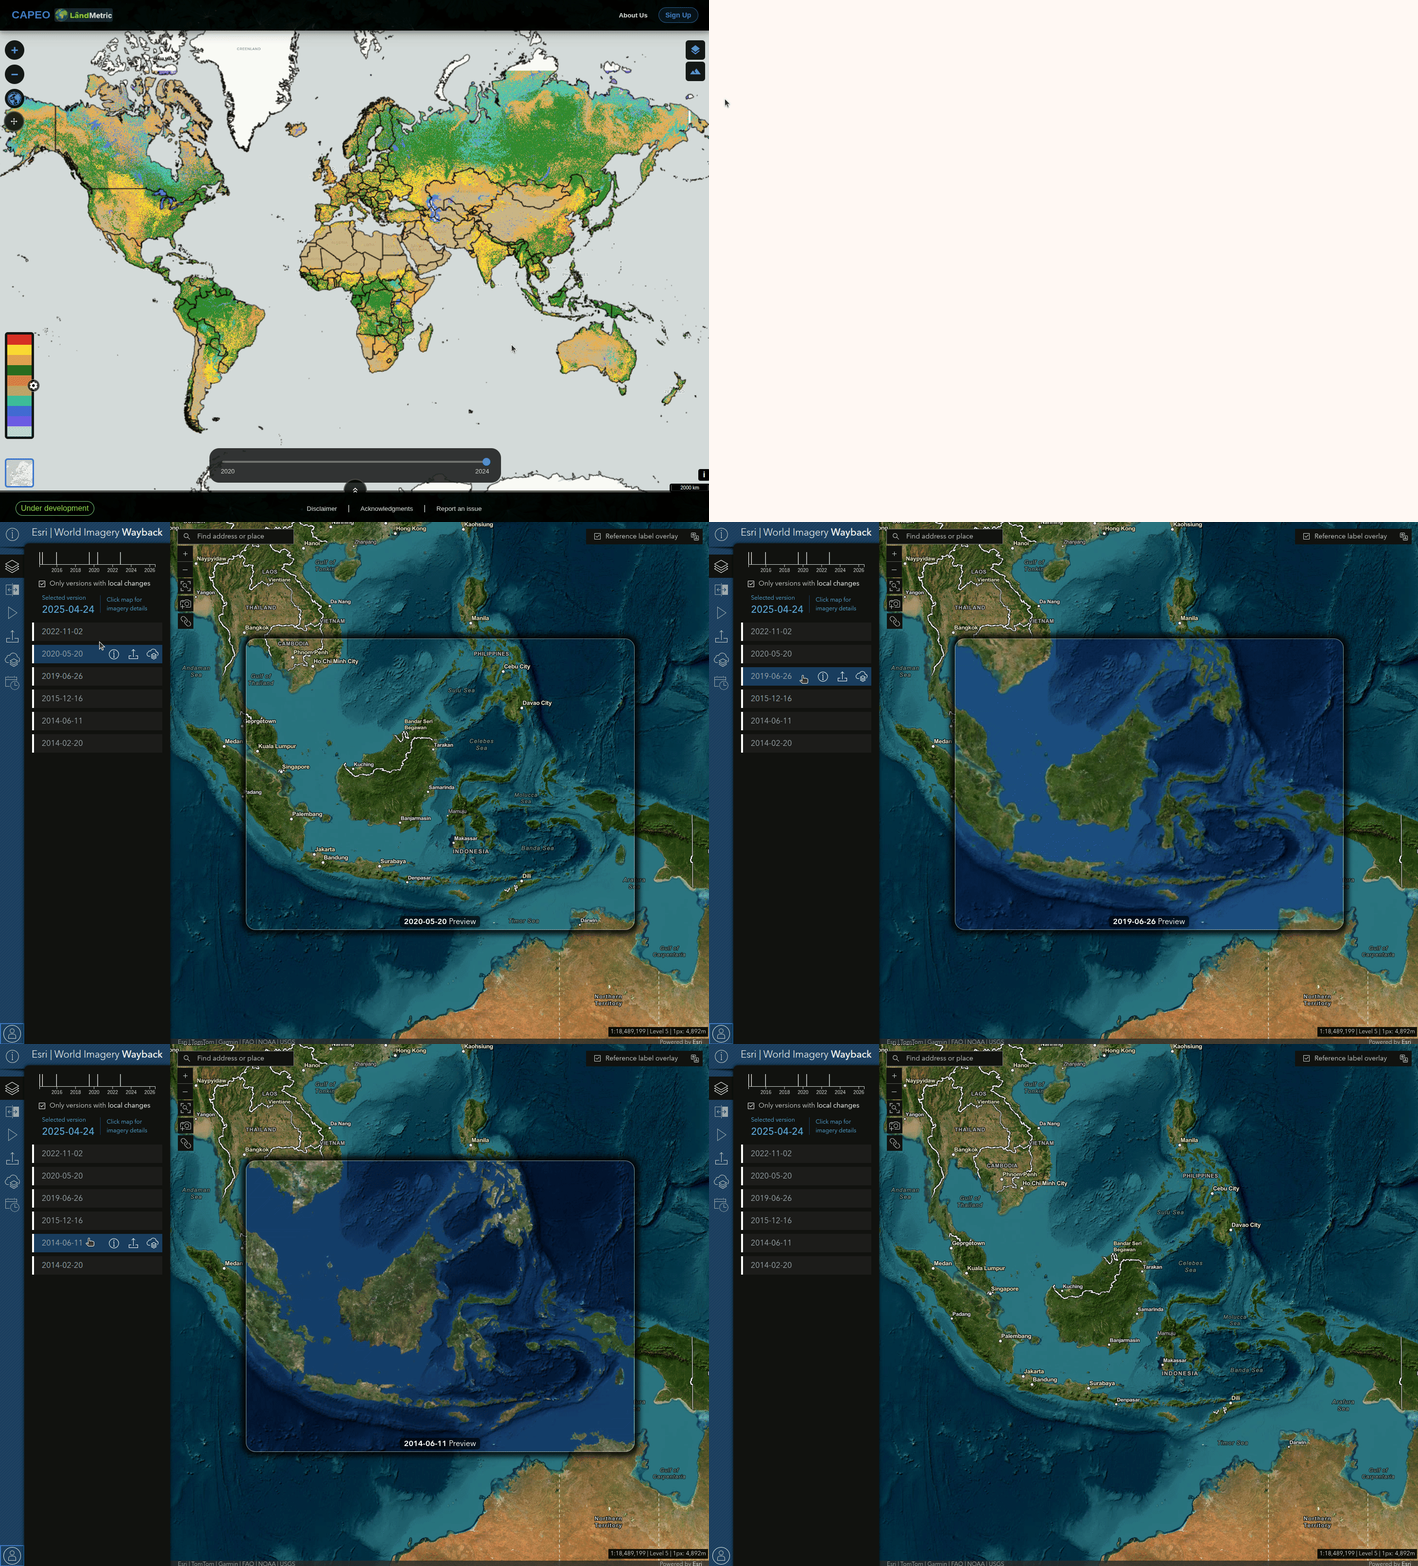
The Open in ArcGIS Wayback button, located next to the map zoom controls, opens the Esri World Imagery Wayback viewer in a new browser tab.
The Wayback viewer automatically uses the current CAPEO map location and zoom level. You can then explore historical satellite imagery by moving through the available imagery timeline.
For example, after zooming to Kalimantan in CAPEO and selecting Open in ArcGIS Wayback, the Wayback viewer opens at the same location and zoom level.
Next: Data Integration →